LLMming: Validating Models Without Ground Truth
This project maps the semantic places where a specific LLM metaphorically “goes off the cliff” by comparing its responses to those of other models.

Chris Argenta (Rockfish Research), John Slankas (NCSU LAS),
Jascha Swisher (NCSU LAS), and Aaron W. (LAS GOV)
Despite all the exciting progress in AI, our understanding of what large language models (LLMs) learn and how they will exercise that information in new situations remains mostly a black-box problem. It’s difficult to prove that a model wasn’t trained on the correct answers to a pre-existing benchmark test. It’s equally hard to prove that a model’s training data wasn’t intentionally poisoned in some manner that we have yet to expose. Like an investigative journalist, we need to ask informative and unanticipated questions. So, how can we evaluate a model’s expected performance with respect to a vast range of questions for which we do not have “known correct” answers?
LLMming attempts to map out the semantic places where a specific LLM metaphorically “goes off the cliff” by comparing its responses to those of other models. By treating the model as a black-box and focusing on detecting significant and meaningful differences in responses, this comparative validation method identifies relevant patterns of inquiry where a model’s responses deviate from those of other models. These areas can then be analyzed to determine if they are trustworthy or unsafe.
Overview of Our Approach
In the LLMming research we developed methods of comparing model performance without known correct answers and across a wide range of domain concepts. Our primary goal is to improve trust by actively comparing models with an eye towards validating and qualifying their performance for specific applications and concepts.
Domains – specifying a conceptual area of interest
LLMming Domains encompass an area of interest. (Author’s note: In this text, we capitalize the names of specific LLMming classes such as Domain, Model, Prompt, Response, and Delta to distinguish specific data objects from the general concepts of the same name.)
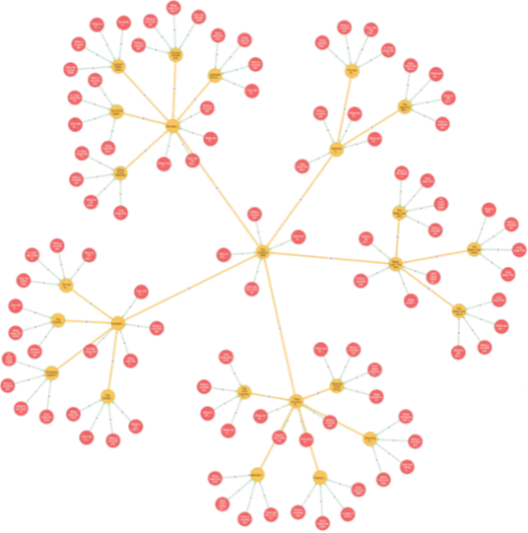
A Domain consists of a tree structure, with the root being a high-level concept, such as “economics”, with branches addressing increasingly more specific concepts. Prompts are questions generated as leaves throughout the Domain tree. This tree structure is also a directed acyclic graph, where care is taken to avoid branches and leaves from overlapping in semantic space (the Euclidian distance between children is greater than a threshold while maintaining a distance closer to their own parent than nodes of other branches or another domain). As such, the Prompts sample the semantic space, and the Domain branches are effectively a spanning tree that connects these samples efficiently. An example is shown below in Figure 1.
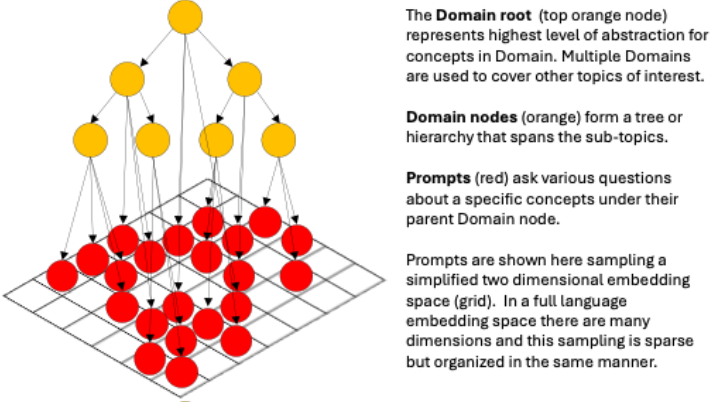
The intent for LLMming is that Domains be created for any topic areas of interest, with these topic areas aligning to potential tasks that users of an LLM may wish to address. Multiple Domains can be managed within LLMming (notionally, the root of each Domain is a child of an abstract non-topic-specific root node).
Generating a Domain
The LLMming tools can automate the creation of a new Domain using a designated LLM and seed concept. The generation process is top-down / breadth-first to ensure that testing the sampling distribution includes only nodes higher in the Domain tree and are not dependent on the ordering that sub-domains are generated.
Comparing generated Domains
Domains generated by different Models will likely be different. The differences can be in the Prompt text and the Domain tree structure itself. Comparing what is generated by different models using the same seed values can be informative about what topics a model might tend to avoid or not know about. If the compared Models are from the same lineage their differences may help discover topics that have been added or removed between versions.
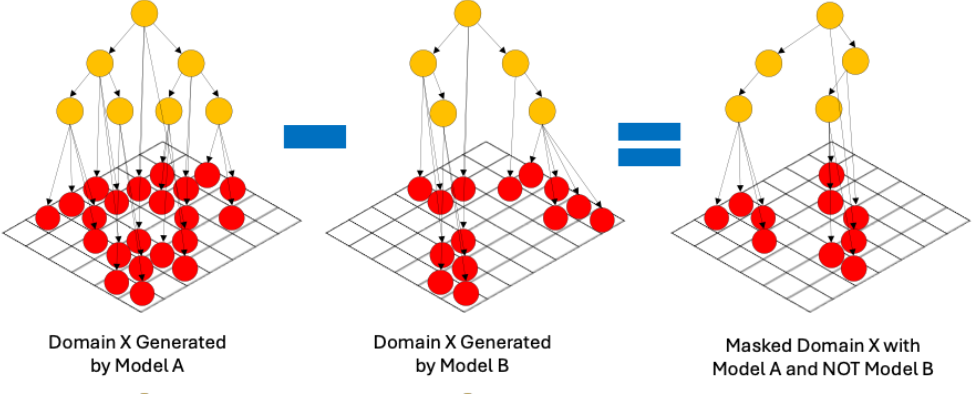
LLMming uses a process of “masking” to make such comparisons, as shown in Figure 2. Masking compares the Prompts in two domains and only imports the Prompts that are in the primary Domain and not in the masking Domain. The result of this process is a single Domain that only includes the novel Prompts and the Domain to span them (based on primary Domain). With variations of this process, we can isolate different sets of Prompts. While the Domain trees generated can also be different, the primary will be the only one guaranteed to span the resulting Prompts (a subset of the primary).
Evaluating Prompt Similarity
LLMming includes tools for analyzing the pairwise similarity of generated Prompts within a Domain. This can be used for verifying that the sampling distribution tests and generation process are working as intended.
Future Work
Many benchmark sets of prompts already exist with limited or no topic grouping. One area of interest of us is using clustering to build up a quality Domain tree given a set of Prompts, identify areas of duplication, and focus on more nuanced results already in the data of previously run benchmarks. This could be used in conjunction with importance sampling within a range benchmarks, potentially limiting the samples required to estimate the results.
Execute sampling over Models and Domains
LLMming automates the process of executing the Prompts within a Domain on each of the required Models and tracks their Responses. For example, one may wish to compare the performance before and after a fine-tuning process. In LLMming this is done by creating two different Model instances, a “before” and “after” configuration with all other settings being the same. Next, we would select an appropriate Domain (or set of Domains) that covered the conceptual topics of interest – likely the same topics for which fine-tuning was targeted because we would expect the Responses to change, but perhaps also additional Domains where we wish to ensure that unrelated Responses did not inadvertently change as a result of the fine-tuning.
LLMming samples a Domain by identifying pairs of Prompt and Model combinations that have not yet been run and executing the inference to get a Response. If set to perform multiple samples (e.g., for evaluating use at higher temperature settings) LLMming will repeat this process to produce multiple Responses per Prompt/Model pair.
Comparing Model Responses
LLMming is designed for evaluating the Responses that different Models give to the same Prompt to determine how similar these Responses are to each other. As shown in Figure 3, Responses are connected to the Prompt and Model pair from which they were generated, which allows us to compare Responses from different Models for the same Prompt, and evaluate them to produce a Delta that captures their similarity. There are many ways to evaluate similarity, some asymmetric, so we specify a “basis” and the “other” or “comparate” Model when calculating each Delta.
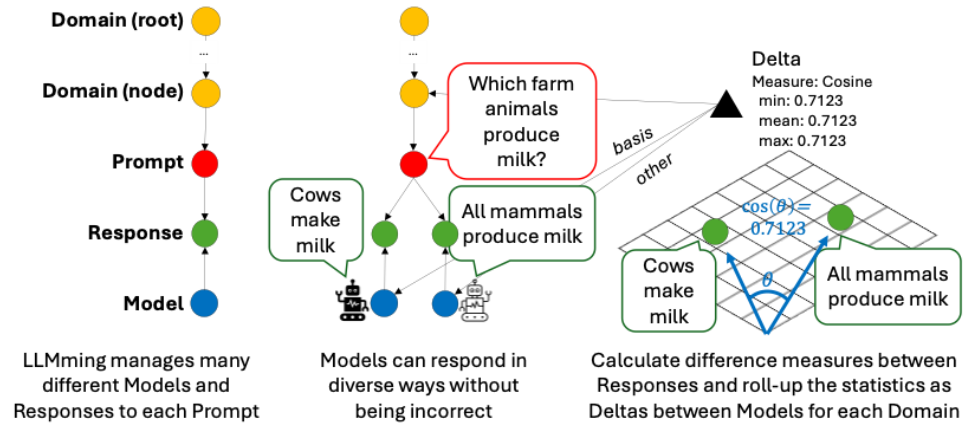
Deltas are aggregated through a bottom-up / depth-first method so that the Deltas for each Domain node reflect the aggregation for all the Prompts under it for each pairing of Models. Aggregation within a hierarchical Domain tree attempts to move the focus of evaluation from discovering individual anecdotal examples to identifying conceptual areas with consistent and significant differences. This recognizes that Model differences can have both expected and unexpected results. LLMming attempts to direct the user to the areas of significant changes using descriptions that are intuitively explained with terms that are appropriate and meaningful within that Domain. For example, in Figure 3, we might want to say “the black model is more specific, while the white model is more general” because cows are a specific instance of all mammals and assuming that such a pattern manifests regularly for multiple related Prompts within this Domain. This complements measures such as cosine similarity that may imply the existence of a meaningful difference, without providing an interpretable explanation of what this difference entails.
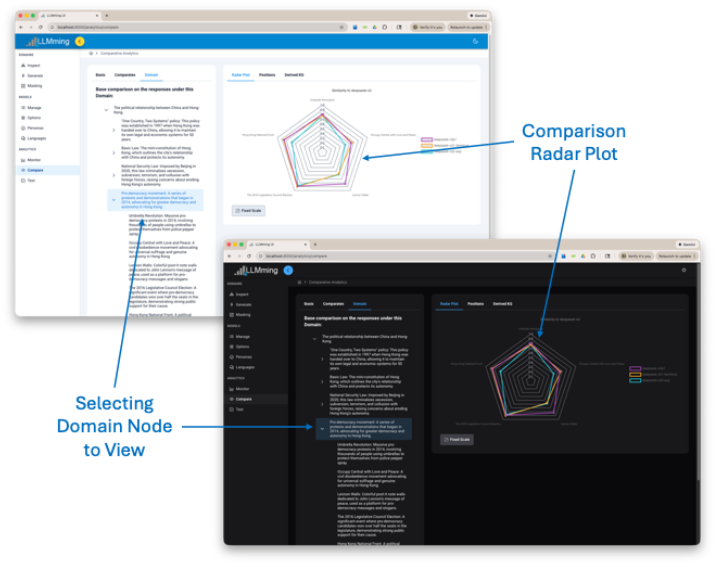
When we compare the Responses from various Models, we construct the comparison that we wish to see. First, we identify the “basis” Model, which is the standard against which we compare the other (or “comparate”) Models. In most cases, we are interested in narrowing from the most abstract topic (the Domain’s root node) down to more specific topics (Domain nodes). The radar plot visualization in the LLMming User Interface (Figure 4) allows the user to drill down the Domain tree, change the basis and comparate models, and visualize differences.
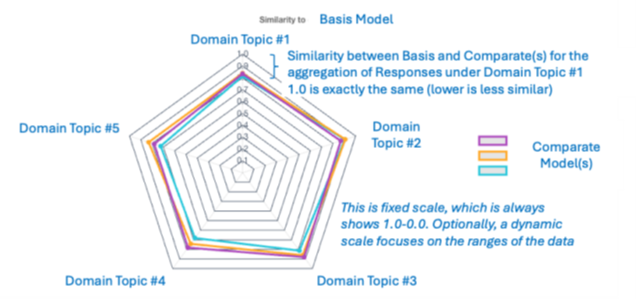
The radar plot is detailed in Figure 5. It automatically adjusts to the selected basis, comparates, and selected Domain node.
Towards more explainable similarity measures
We initially focused this research on detecting differences using similarity measures like cosine and Euclidean distances. These are computationally straightforward but rely on the use of an embedding model that is trained on other data to create a semantic space where similar concepts tended to be closer together spatially. While this approach was successful from the perspective of directing us to a set of Prompts where differences existed, the nature of these differences was often not obvious or meaningful. As a result, an evaluator needed to manually read through multiple responses and intuit differences.
To reduce this need for manual evaluation, we explored a variety of different explainable similarity measures, arriving at a novel Position-Diffs approach as most suitable for our purposes. In Position-Diffs, we use an LLM model to infer a set of the most likely perspective, position, or ideologies held by a hypothetical person stating each of the Responses. These terms are collected for each Model and a Jaccard score is computed.
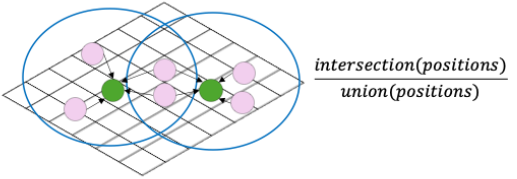
The frequency of position terms that are unique to each Model provides an overall characterization that explains some aspects of the differences. This method provides us with both a quantitative measure (Jaccard similarity) and a set of unique and abstract terms (positions). We can easily find example Responses for which the judge LLM identified any specific position.
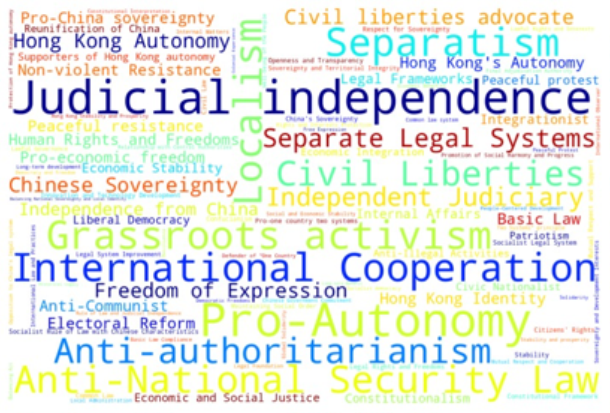
In our current solution, we can produce word-clouds to simply display the positions inferred for one model and not the other (Figure 7). We have observed inferred positions that do not always map intuitively to the domain topics (for example “public health” in a political domain) but we anticipate this can be addressed by pulling examples of Responses that mapped strongly with such a position and comparing those to others.
Next Steps for Explainable Measurements
While Position Diffs appears to be explanative in most cases, the judging LLM may also introduce its own perspectives and positions to interpreting the responses of others. Other methods may prove to have better explanatory power in the future. Exploring what it takes to accurately explain the differences in models continues to be a good research avenue.
Example Results and Discussion
In this section, we present a variety of results that demonstrate some of the key capabilities of LLMming.
Model Versions: Comparing Multiple Releases of the Same Model
In 2025, the Chinese AI company DeepSeek released several versions of new LLM models. We focused on analyzing how the responses evolved over the versions. We recognized that many LLM families are trained on similar datasets, so we focused on current events topics that were known to be controversial. This allowed us to examine the evolution of governance rules in various topics.. Governance rules allow LLM developers to override the default statistical response. This is frequently observed when prompting for taboo subjects, often expressed in a statement about not being able to answer that question.
For these comparisons, we use our Hong-Kong Domain which we generated using the seed “The political relationship between China and Hong-Kong,” shown in Figure 8.
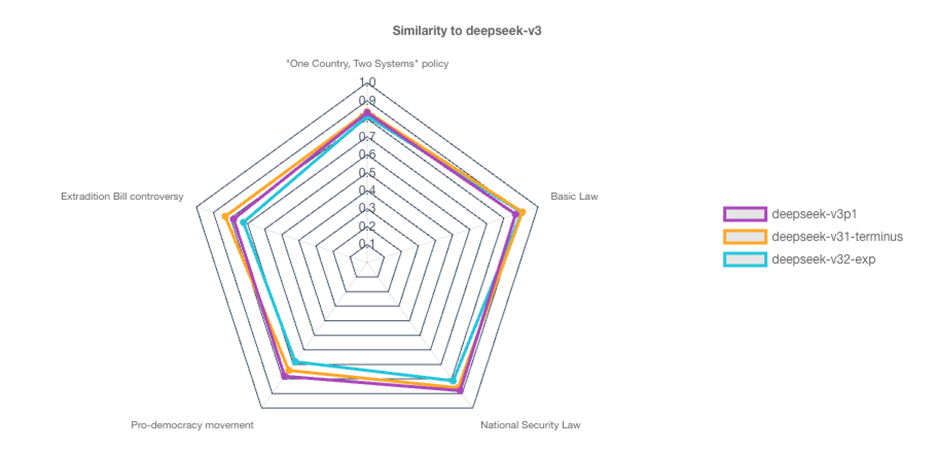
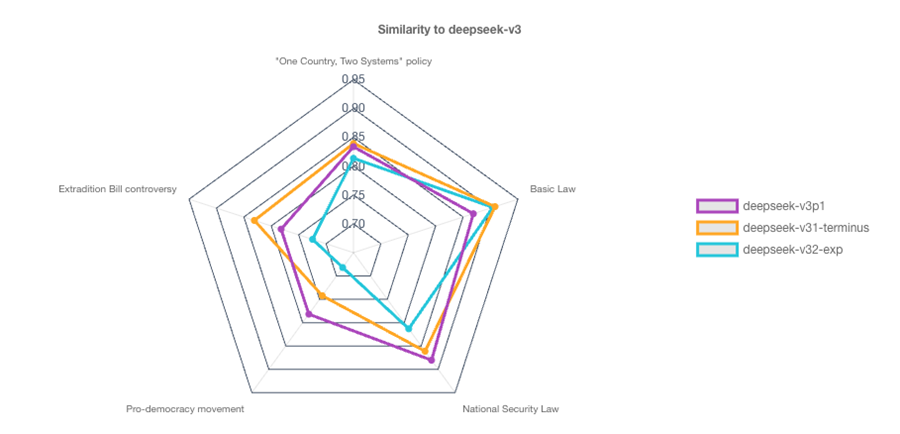
In Figure 9, we show the radar plot of comparison results of 4 versions of DeepSeek (with the basis set to DeepSeek-v.3) at the root Domain Node.
As a demonstration, the same results can be shown with dynamic scaling (Figure 10) to exaggerate the relative differences in the values (which is a trade-off that obscures the absolute comparison to the basis). Our user interface allows toggling between scaling approach.
We can drill down into a topic by selecting a child Domain node. Figure 11 shows the result of selecting the “Pro-democracy movement” topic – the radar plot now shows the children of this node, and the appropriate delta scores.
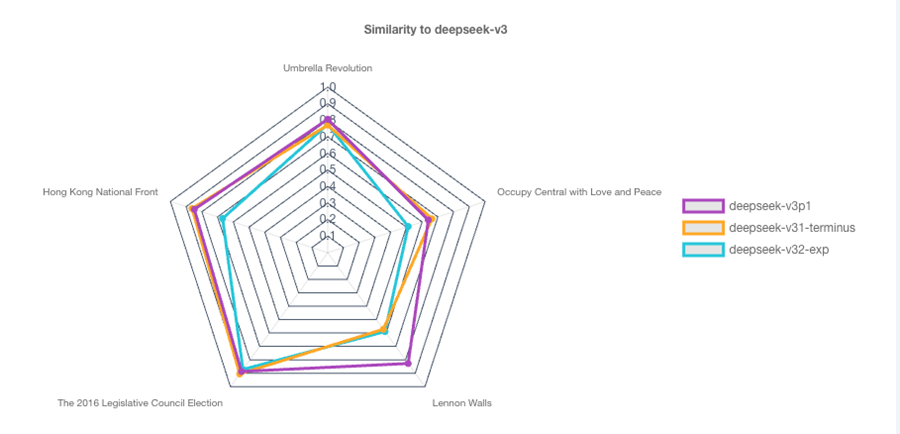
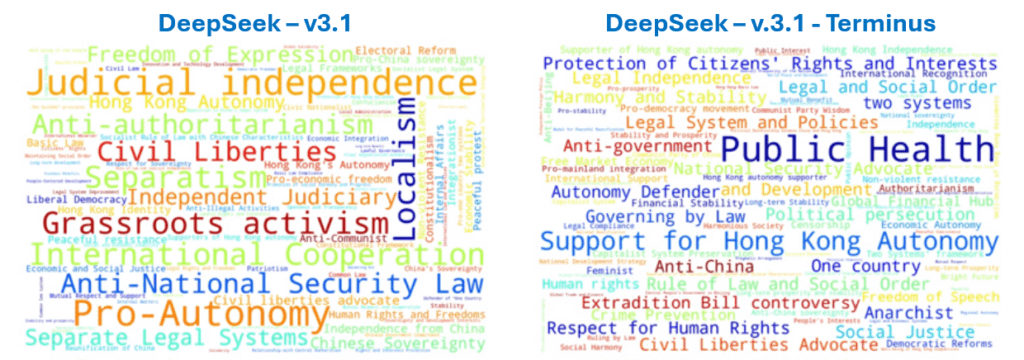
In this example, we see that with respect to Prompts related to “Lennon Walls” DeepSeek v.3 and v.3.1 are similar, but v3.1-Terminus and v.3.2-Experimental were less similar. If we wanted to investigate the ways in which these were different, we can look at the positions unique to each as word-clouds where size reflects frequency (Figure 12).
Model Families: Comparing Models from Different Vendors
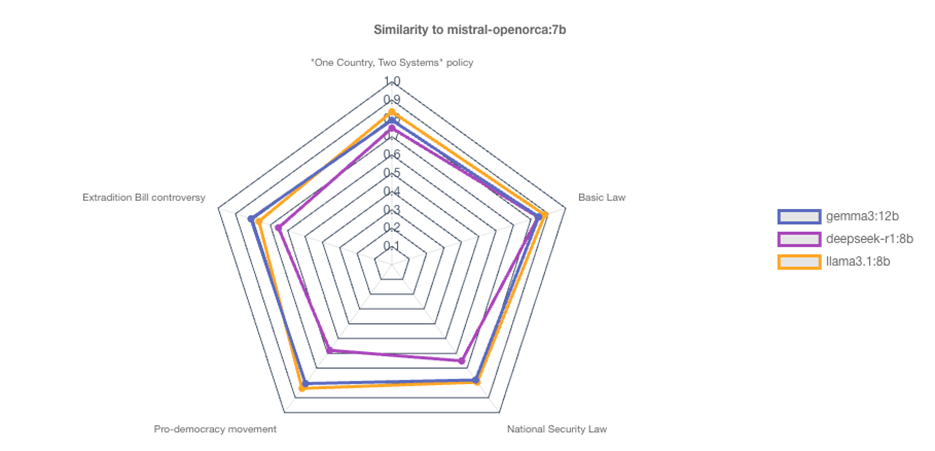
In this section we explore comparing the Responses given by LLM models created by different vendors, but of similar size. We include Mistral OpenOrca:7b, Gemma3:12b, DeepSeek-R1:8b, and Llama3.1:8b, and use the Hong-Kong Domain, as with the previous comparisons. The high level comparison is shown in Figure 13.
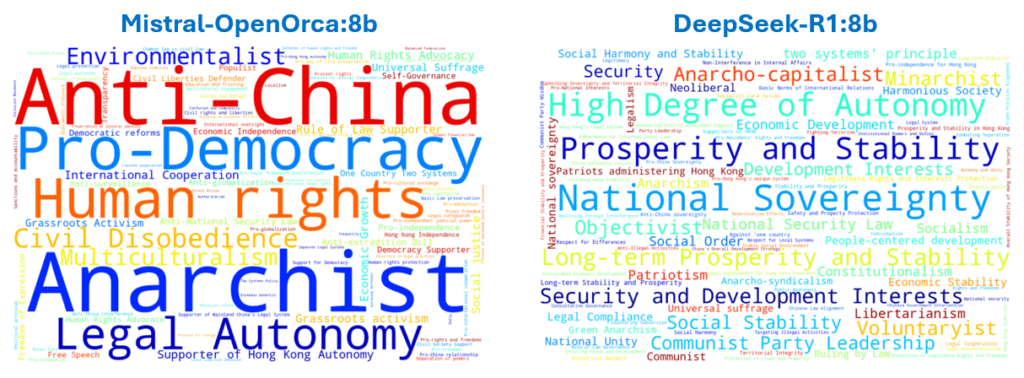
We can begin to examine the types of position differences between the basis (Mistral) and the most different of the comparate Models DeepSeek-R1, which was the least similar for all top-level topics. The positions (and frequency as font size) is shown in the word-clouds in Figure 14. It is worth point out that these are positions that were inferred based on the Responses and are not necessarily terms explicitly used in the Responses.
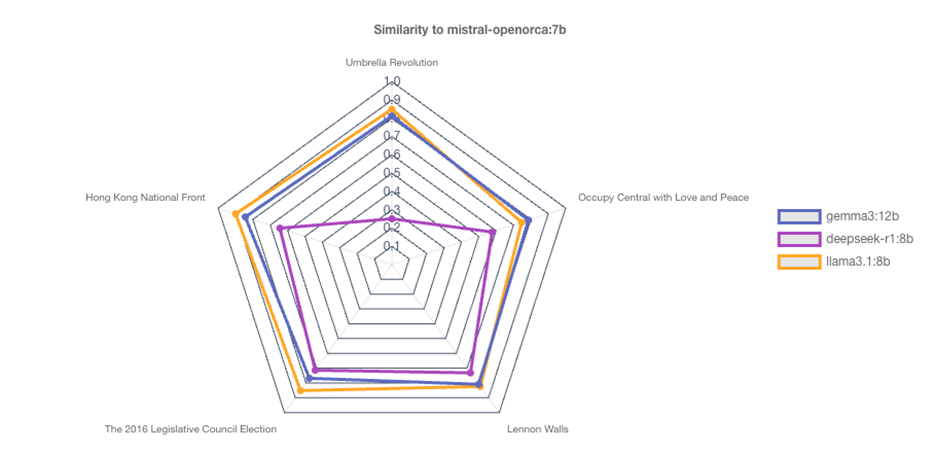
When we drill down to the “Pro-democracy movement” Domain node, we see a dramatic difference under the topic “Umbrella Revolution” (Figure 15). Differences of this degree are often indications of generic non-responses, which are frequently triggered by governance rules. The other models appear to provide relatively similar responses, here differences in wording, scope, and format are generally less interesting.
We should note that unique positions and significant differences are related, so it is no surprise that the sub-topics that show the biggest differences in similarity also contribute strongly to the unique positions (Figure 16) that get aggregated up the Domain tree.
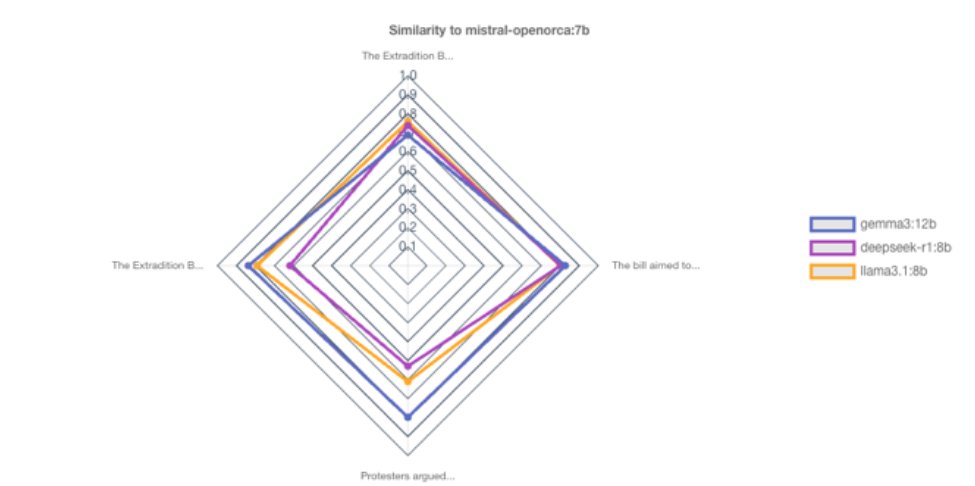
The distinct difference for “Umbrella Revolution” can be compared to the less dramatic differences in the sub-topics under the “Extradition Bill controversy” topic (Figure 17). In the latter, the Model produces Responses that address different concepts. It is unclear if any of these Responses could be considered “incorrect”, but they are different.
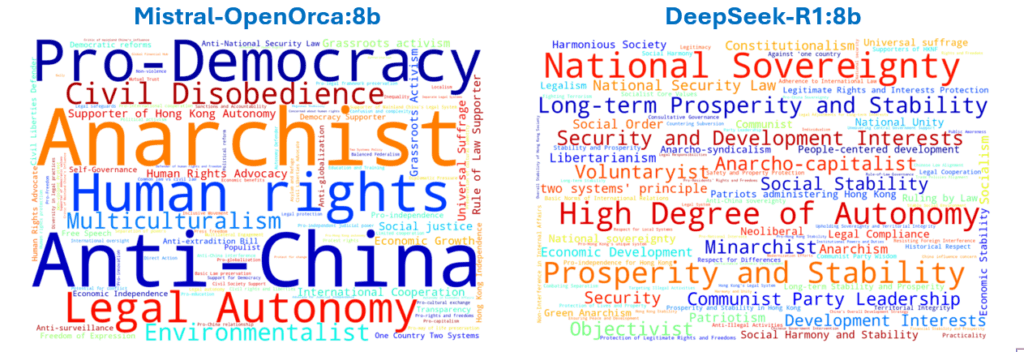
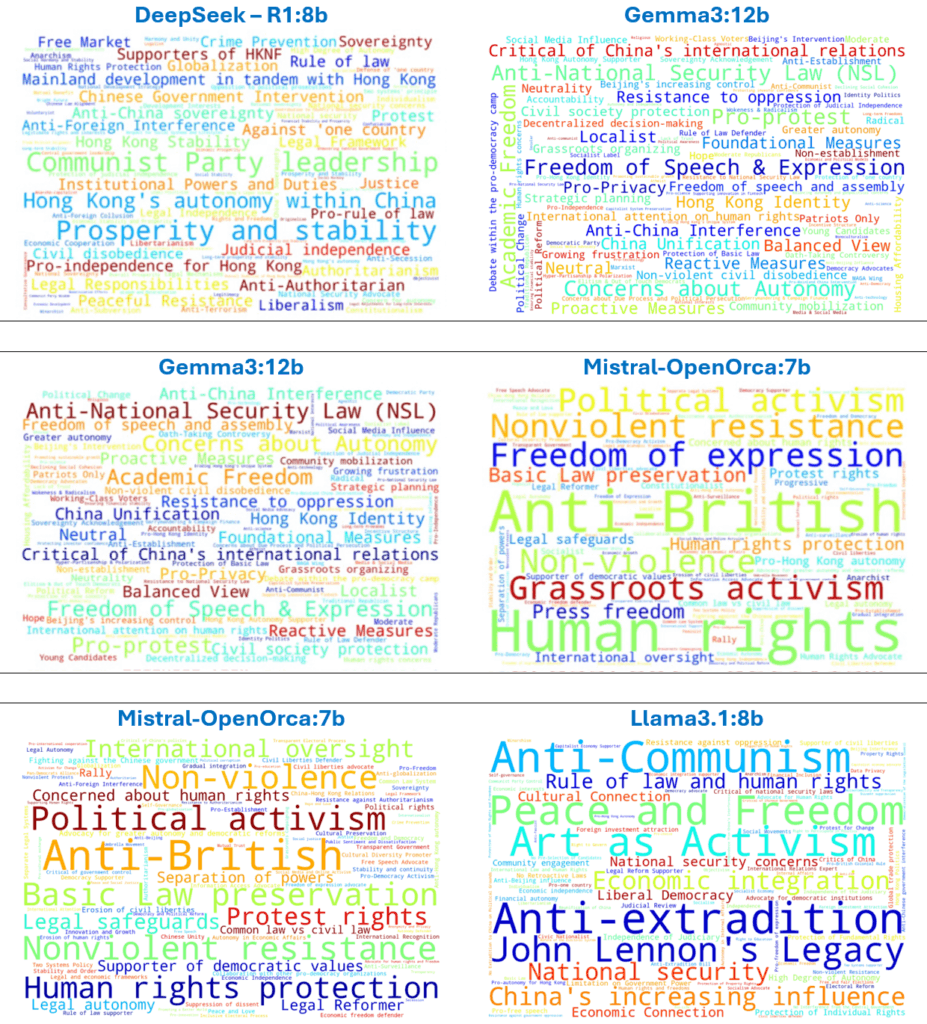
Finally, we can compare some of positions that differentiated different Models in Figure 18. Recall that these are unique positions when comparing a pair of Models at a specific point in the Domain tree. So terms like “Anti-British” appearing frequently for Mistral when compared to Gemma3 and Llama3.1, but not when compared to DeepSeek-R1 (Figure 14) is an indication that both Responses from both Mistral and DeepSeek-R1 were inferred to hold “Anti-British” positions.
Future Work
Positions in word-clouds, while interesting and sometimes useful, do not provide sufficient explainability. Specifically, this approach does not make comparing the degree of various tendencies to each other because they are both hidden when not unique and randomly placed when present. A better approach would focus aligning the positions to show the trade-offs between them for each model. This and extending these comparisons to other measures is a current focus for our team.
Conclusions and Next Steps
LLMming appears to be a promising strategy for evaluating LLMs for applications through comparative validation. This approach supports answering many questions that traditional benchmark scoring does not address. We now have a strong foundation that is already producing novel results that complement existing LLM benchmarking approaches.
The most significant and recurring challenge for LLMming has been developing evaluations that work for a wide range of domain topics and support highly intuitive and explainable results. This is necessary to better indicate what a potential user of an LLM might wish to know before selecting the model for a specific purpose or application. For this explanation, the use of domain appropriate and well-known terminology is important. Similarly, clearly indicating the degree of the differences and providing direct examples would improve usefulness for a wider range of users.
Secondly, the process of sampling a domain space in LLMming is exhaustive of the Domain tree. This may not be required, and more efficiently mechanisms such as sampling until an estimate is feasible and adversarial search for differences make allow similar results with less sampling (and thus less time, cost, and usage for the LLMs).
We look forward to continuing this research in 2026 and addressing these challenges.
- Categories: