Voice Characterization Analytics for Triage
2023 was a wild year for the Voice Triage Team. We set out on an exploration to observe the performance of two algorithms on ‘data-in-the-wild’ and explored the tangled jungle of implementation paths on the corporate network. Our expedition goal remains to equip analysts with a tool that indicates how people are talking. As our team expands we’re able to venture in more directions: more algorithms, more data, and more analysis.
Algorithms: Tools for Our Expedition
We continued our partnership with University of Texas at Dallas (UTD) this year to pursue two distinct algorithms: a lean SVM baseline created by LAS government researchers, and a contrasting deep-net sophisticated algorithm created by UTD.
Support Vector Machine Baseline
The goal of our baseline algorithm is to detect high-arousal speech, that is, the speech that results when someone increases energy to express emotion, whether it’s positive or negative.
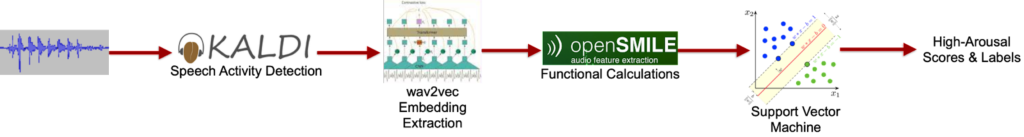
The input features for our SVM-based algorithm start with wav2vec embeddings calculated on speech segments defined by a Kaldi-based automated speech activity detector (SAD). The wav2vec algorithm, released by Meta in 2019, uses a convolutional neural network to convert speech into a general representation vector. Since wav2vec creates a 512-element vector for every 10 milliseconds of speech (i.e. 100 vectors per second), we used OpenSMILE’s functional calculations to generate the fixed-dimensional vectors expected by the scikit-learn SVM software. Our 2022 research revealed three well-performing functionals:
- 2nd linear regression coefficient
- Linear regression error
- Upleveltime25 (amount of time the signal is above 0.25*range)
The SVM model uses a radial basis function kernel with a kernel coefficient of 1/n (n=1536, the feature-vector length) and a regularization parameter of 1.0.
The figure below illustrates the SVM speech-to-labels process:
University of Texas at Dallas
The Multimodal Signal Processing (MSP) Lab at UTD, led by Dr. Carlos Busso, has been researching and developing robust speech algorithms for several years. As an LAS performer, they’ve led research exploring preference learning of emotional speech leveraging existing emotional labels from current speech databases and developed and evaluated machine learning algorithms to quantify emotional similarity between audio recordings.
As a 2022 LAS performer research, UTD evaluated several preference learning algorithms for speech-based retrieval, including an algorithm comprised of combinations of ladder network (LN), adversarial domain adaptation (DA), chunk-based segmentation (CBS) and fully connected (FC) layer models to determine which path provided the best performance gains for speech emotional characterization. Based on UTD’s evaluation results, the CBS→LN→DA model pipeline (shown in the figure below) had the best performance across all evaluated methods.
Preference Learning Algorithm

For more information regarding the corpora, experiments, and results on this algorithm, please read their blog.
The Wilderness and Wildlife
Although our algorithms worked well on the large, realistic, yet curated MSP podcast corpus, we wanted to examine how well they functioned on uncurated, i.e. wild, data. We chose four corpora for this examination:
- EyeReckon audio-from-video: Our EyeReckon project created a corpus of videos containing audio.
- Nixon White House Recordings (NWH): 147 hours of recordings from Richard M. Nixon’s presidential term.
- Johnson White House Recordings (LBJ): 611 hours of recordings from Lyndon B. Johnson’s presidential term.
- Kennedy White House Recordings (JFK): 465 hours of recordings from John F Kennedy’s presidential term.
None of these corpora contained labels when we began our examination. However, we slowly accumulated labels using two paths:
- Independent labeling: One of our LAS analysts listened to many of the recordings and documented her findings in a spreadsheet.
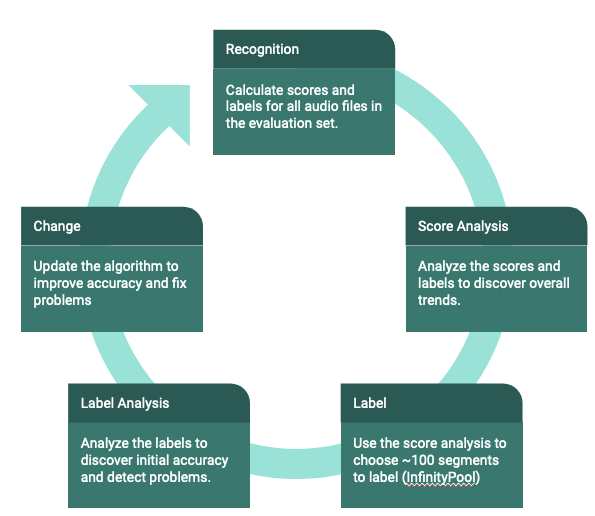
- Analysis-based labeling: As shown in the figure below, our analysis-based labeling starts with executing our algorithm on the unlabeled data. After analyzing the resulting scores, we choose about 100 labels that will yield helpful information regarding the performance of the algorithm. We set up a labeling task in InfinityPool and ask our team to complete the labeling tasks, accumulating three to five labels per segment. Once we have the labels, we analyze them and decide what algorithm changes should be pursued. The process starts again after we have new scores from the hopefully-improved algorithm.
Field Notes
We learned several lessons from our wild-data analysis – here is a brief description of the more interesting findings.
Neutral Speech is Natural
Although the curated corpus abounds with high-arousal speech segments, our SVM algorithm detected very few high-arousal speech segments. We were concerned the algorithm was falsely rejecting segments that really contain energetic speech, but our analysis-based labeling verified this finding – people don’t often get excited about what they’re talking about. However, since our goal is to find unknown-unknowns in a big pile of data, this is more a justification for our research than a problem to fix.
Music is Confusing to Machines
Early on, we chose not to expend our limited resources on creating a SAD algorithm, but to deploy one based on expert recommendations. We discovered, however, that this algorithm often confuses music as speech. With the help of outside experts we found a music-detection algorithm, ina Speech Segmenter, that achieved sufficiently high music-detection to use as a SAD post-processing filter.
Hidden Arousal
The labels provided by time-consuming independent labeling revealed that short-duration (e.g. 3-10 seconds) high-arousal spurts were being washed out in the scores calculated on longer segments. We started an experiment to determine the effectiveness of sub-segment analysis, i.e. calculating high-arousal scores on smaller, overlapping segments within the longer segment. An example of this idea is shown below.

The speech in the top portion of the figure is a 10-second segment of a 1968 telephone conversation between President Johnson and Dean Rusk discussing the Vietnam situation. The first label track indicates the SVM algorithm calculated a high-arousal score of 0.31 – i.e. a low probability of high arousal. However, as the second label track shows, independent labeling found a 3-second high-arousal portion. The remaining label tracks show what we hope we’ll have from our subsegment analysis: detection of high-arousal in small portions of the speech segment. We’ve colored subsegments that overlap with the high-arousal portion of the segment, showing that as the subsegment contains more high-arousal speech, the subsegment probability increases.
Noise
One of the characteristics of our data-in-the-wild is its realistic recording conditions. Unlike the podcasts in our curated corpus, these recordings were not collected in controlled environments. We discovered that noise can cause significant problems, and began experiments to investigate methods to mitigate this. We used the WADA SNR (Waveform Amplitude Distribution Analysis), which is an algorithm for estimating the signal-to-noise ratio (SNR) of speech signals and is also being used by the UTD MSP team for SNR filtering. This SNR filter was run on all speech segments in our in-the-wild experiments and we determined to evaluate segments with an SNR greater than 5.
What We Want to Do Next
We’ve made good progress this year, but there’s still a lot left to do.
We’ve had several encouraging meetings with mission, and they’re interested in our progress. We’ll continue to keep them apprised of our headway and continually ensure we include their ideas and suggestions as we move forward.
As mentioned above, we’ve begun seeking an implementation path in the corporate network jungle. Moving from the research to mission space presents a lot of challenges since there are no straightforward LAS research-to-corporate pathways in place. We have investigated and evaluated several implementation pathways using corporate hosted environments, including LabBench, the GM platforms, MASH and LAS C2S/MASH resources. As a result of these assessments, we have come up with a strategy for 2024 to operationalize and implement our best algorithms in the mission DIY spaces, utilizing existing speech analytic tools for speech processing and integrating the high arousal analytic in existing evaluation platforms and DIY spaces to be able to better engage with the analysts at large to elicit feedback and to leverage access to analyst’s mission relevant data feeds for analysis and labeling.

Come back next year and see how far we’ve progressed in our expedition!
“This material is based upon work done, in whole or in part, in coordination with the Department of Defense (DoD). Any opinions, findings, conclusions, or recommendations expressed in this material are those of the author(s) and do not necessarily reflect the views of the DoD and/or any agency or entity of the United States Government.”
- Categories: