Investigating How Individual Differences Influence Algorithm Confidence Interpretations
Sunwoo Ha, Washington University in St. Louis
Chaehun Lim, Washington University in St. Louis
Syrine Matoussi, Smith College
Emily Kung, Smith College
R. Jordan Crouser, Smith College
Alvitta Ottley, Washington University in St. Louis
Project: Visual Analytics System for AI-Based Speech-to-Text Analysis and Exploration
INTRODUCTION
While machine learning models are increasingly employed to aid in decision-making, their results inherently carry a level of uncertainty, meaning that the accuracy of a specific prediction, label, or recommendation cannot be guaranteed. Additionally, the reliability of an algorithm’s output is connected to the historical data used for training, which may be tainted by bias and input errors. Consequently, the success of this kind of human-machine collaborative analysis hinges on the human’s ability to effectively calibrate their trust in the algorithm’s output. Accepting a biased or inaccurate suggestion can lead to suboptimal decisions, especially in critical decision-making scenarios.
Trust is a complex concept, yet it plays a crucial role in the way humans interact with machines. Various domains have explored the subject of trust over the past few decades in the context of areas like Machine Learning[1], Automation and Robotics[2], and Information and Communication Technology[3]. The field of Information Visualization has also recently turned its attention toward understanding trust, with most research efforts focused on identifying optimal contexts for its application[4][5] and drawing on related insights from fields ranging from psychology[6] to cartography[7].
In this blog post, we’ll describe our efforts in two coordinated studies on the role of trust in the context of data visualization.
A SOCIAL SCIENCES PERSPECTIVE
The Oxford English Dictionary characterizes trust as a “firm belief in the reliability, truth, ability, or strength of someone or something.” Alternatively, personality psychologist Rotter defined trust as a personality trait[8] described as a “generalized expectancy that the oral or written statement of other people can be relied on.” Both definitions underscore the common expectation of reliability as a fundamental element of trust. In contrast, sociologists tend to describe trust as a social construct, categorizing it as a group attribute rather than an individual one[9]. Social theorist Niklas Luhmann[10] argued that “familiarity is the precondition for trust and distrust,” asserting that trust requires familiarity with the object of trust. Economic sociologist Georg Simmel[11] contends that in the face of the unfamiliar, individuals are more likely to “gamble” than to “trust.” This perspective aligns with that of many behavioral economists, who see trust as “the mutual confidence that no party to an exchange will exploit another’s vulnerabilities”[12]. This concept of confidence, particularly in decision-making under uncertainty, is evident in several prior works[13],[14],[15],[16].
Some have suggested evaluating trust as an enduring trait in individuals and studying it as a comprehensive construct that complements personality models such as the Big Five Inventory[17],[18]. For example, Evans and Revelle developed and tested a 21-item scale measuring interpersonal trust[19], including items like “Listen to my conscience” and “Avoid contact with others”. Recognizing this multidimensionality, research in organizational psychology has proposed various dimensions of trust, such as integrity, reliability, and credibility, based on a thorough review of existing literature on trust measurement[20].
AN AI PERSPECTIVE
In the realm of artificial intelligence (AI), trust can be characterized as an individual’s willingness to depend on and expose vulnerabilities to another party with the expectation that the other party will perform a specific action important to the trustor. This reliance is maintained regardless of the ability to monitor or control the actions of the other party[21]. Researchers have developed various mechanisms for gauging trust in AI, encompassing user responses to technological features, perceived utility, ease of use, and trust as a predictor of technology acceptance[22],[23]. Although the factors influencing trust in AI are not fully elucidated, researchers have identified various dimensions relevant in the AI context, such as tangibility, transparency, reliability, task characteristics, and immediacy21.
A MULTIDIMENSIONAL MEASURE OF TRUST IN VISUALIZATION
Most conceptualizations of trust endorse a multidimensional notion[20],[24] and many fields have begun to reason about the role of the relationship between trustors and trustees[21],[25],[26]. Regrettably, this principle doesn’t readily apply in situations where the origin of the visualization is unclear or ambiguous. Conversely, users might distrust a visualization even if it originates from a credible source, especially when the design is poor or the data it depicts on is unreliable. Consequently, our first objective in this project was to establish impartial criteria for assessing visualizations that are not influenced by preconceived biases towards the source or creator.
Table 1 details five critical dimensions of trust identified in the literature: credibility, clarity, reliability, familiarity, and confidence.
| Familiarity | The extent to which users are familiar with the data, topic, and visualization. “I am familiar with the topic or data this visualization presents.”[10] |
| Clarity | The extent to which users can easily understand the visualization. “I understand what this visualization is trying to tell me.”[5] |
| Credibility | The extent to which users believe the visualization is accurate and presents real data. “I believe the visualization shows real data.”[20,24,][27] |
| Reliability | The extent to which users believe the visualization will support sound decisions. “I would rely on the facts in this Visualization.”[5,8,9,20,21,24,27] |
| Confidence | The extent to which users feel confident interpreting the visualization. “I would feel confident using the information to make a decision.”[12,27] |
Experiment 1: Measuring the Relationship between Trust Dimensions and Visualization Design
To explore the relationship between these trust dimensions and specific design features, we enlisted the participation of 500 individuals through Prolific. All participants were English speakers from the United States and received $5 as compensation for completing the study. We used a selection of 410 visualizations from the MASSVIS dataset[28], which encompasses visualizations sourced from diverse outlets like government, news sources, and scientific publications. The visualizations in the dataset were pre-coded with labels indicating features such as the presence of human-recognizable objects and their data-ink ratio.
The experiment consisted of two sections:
- Participants were first tasked with labeling 30 visualizations randomly selected from the pool of 410, using a 5-point Likert scale based on the statements in Table 1. An attention check was included to ensure participant engagement.
- In the second section, participants completed the Mini-VLAT[29] to assess their visualization literacy and explore potential relationships between their responses and various dimensions.
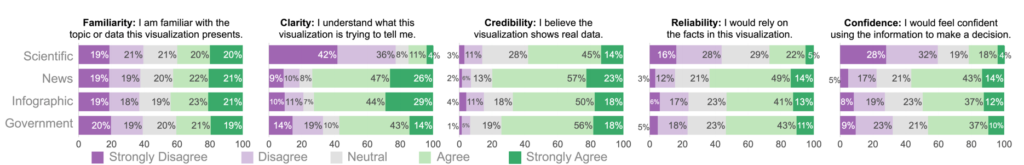
Figure 2 depicts the results of this experiment. We began by examining the relationship between the visualization categories and participants’ subjective ratings based on the five trust dimensions. We ran Kruskal-Wallis tests for each dimension to examine differences in subjective ratings according to the visualization source. Except for FAMILIARITY, there was a significant relationship between the visualization’s source and the dimensions, all with p < .001. Post-hoc Mann-Whitney tests using a Bonferroni adjusted alpha (α = .0083) uncovered noteworthy patterns. For example, scientific visualizations yielded significantly lower ratings than all other categories in CLARITY, CREDIBILITY, RELIABILITY, and CONFIDENCE.
We also observed a low positive correlation (r = 0.31, p < 0.001) between the participants’ ratings on CLARITY and their visualization literacy scores. This provides suggestive evidence that higher visualization literacy was correlated with understanding the message conveyed by the visualizations. This finding highlights the importance of considering the audience’s visualization literacy when designing and evaluating visualizations.
Experiment 2: Exploring the Relationship between Trust and Individual Dimensions
The dimensions from Experiment 1 were curated from a diverse set of existing literature, and we expanded on the results from this experiment to examine how well the observed rating aligns with perceived trust. After filtering for the visualizations with high response rates and low variance, we chose the visualizations that were, on average, ranked to be the best and worst for the given dimension. This resulted in 30 visualizations (six for each dimension). We then examined how trust values were related to the individual dimension values for these selected visualizations.
We recruited 15 participants using convenience sampling, all of whom had bachelor’s degrees, with nine self-identified males and six self-identified females. We used neutral language to avoid unintentional bias; specifically, the information sheet and questions excluded any mention of the five dimensions from Experiment 1. We asked participants to “Rank the following visualizations based on how much you trust them, with 1 being Strong Trust and 6 being Strong Distrust.” Then we asked them to “Please explain your ranking.” Each participant ranked five sets of six visualizations corresponding to the trust dimensions from Experiment 1, and the orders of the options and questions were randomized.
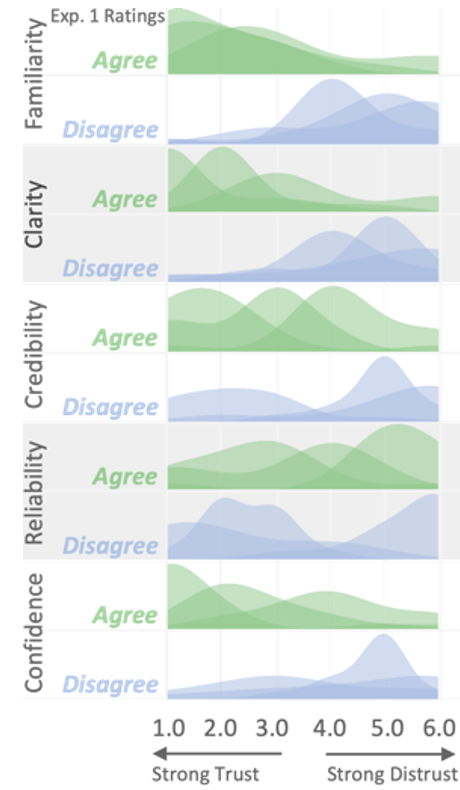
Figure 2 suggests that FAMILIARITY and CLARITY ratings from Experiment 1 strongly aligned with the perceived trust from Experiment 2, with the top three visualizations in both categories eliciting high trust ratings and the bottom three receiving low ratings. For CONFIDENCE and CREDIBILITY,
two visualizations from both the agree and disagree categories were trusted and distrusted, respectively. However, in the case of RELIABILITY, we observed no obvious separation in the trust ratings. There could be several reasons why we observed a different pattern for RELIABILITY, e.g., the differences in our study populations. The concept of reliability is complex and multifaceted, and individual differences may affect interpretation. However, our experiment design traded control of individual differences for controlling learning effects and biases. For further discussion of the results of these two experiments, we refer the reader to the full manuscript and supplemental material[30].
Developing a Visual Analytics System for AI-Based Speech-to-Text Analysis and Exploration
With the increased presence of automatic transcription of speech, commonly known as speech-to-text (STT), it is essential to acknowledge that the output of STT is not always accurate. One method to assist analysts in calibrating their trust is by assigning a confidence score to the output, thereby communicating the probabilistic nature of the underlying algorithms. However, confidence values in transcription output are rarely communicated, hindering complete integration within the workflows and processes of analysts.
Armed with the new information gained through Experiments 1 and 2 regarding the multifaceted nature of trust, we then developed a Visual Analytics system designed to support analysis on AI-based automated transcription of audio recordings. To ground the design of our prototype, we conducted a literature review of techniques to visually display/encode confidence. We then developed several potential designs, conducting user testing and brainstorming sessions with analysts and student researchers. Finally, we iteratively refined the system to create a product that would best support the analyst’s workflow and exploration subject to the following design goals:
- G1: Enable awareness of uncertainty levels in STT output to promote and calibrate trust.
- G2: Support efficient exploration of audio transcription files through coordinated views.
- G3: Provide contextual knowledge on demand.
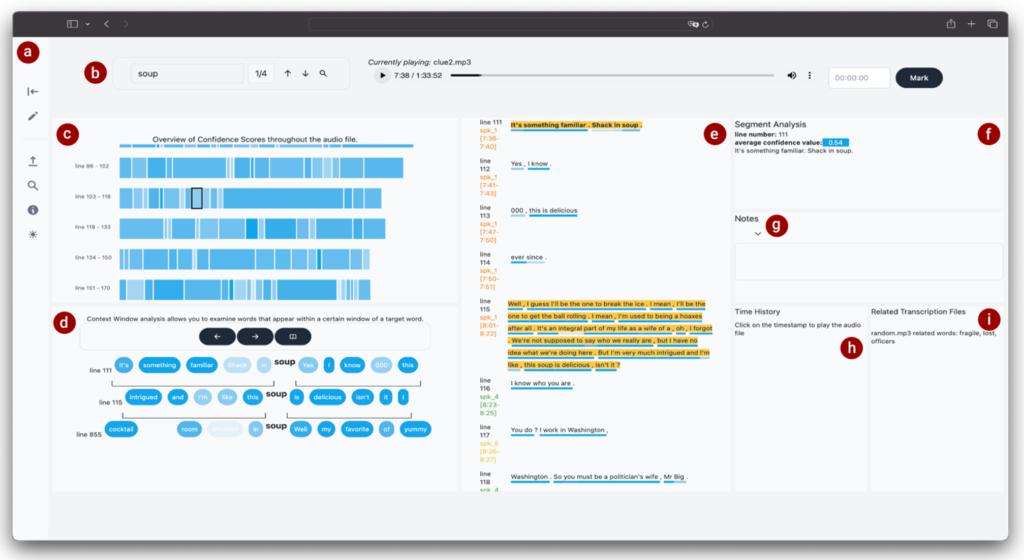
A screenshot of the resulting prototype system appears in Figure 3.
Using this system, we are now in the process of systematically investigating individual traits’ role in choosing between accepting automated transcription output or listening to the source audio, guided by the following research questions:
- RQ1. What methods for displaying confidence scores are most helpful in trust calibration?
- RQ2. How does visual design impact trust decisions? In particular, does the visual encoding affect the decision to either defer to algorithms suggestion or to query the source audio?
- RQ3. Which cognitive traits are reliable predictors of trust behavior?
We look forward to reporting further results of these experiments in the near future.
References
[1] P. Schmidt and F. Biessmann. Quantifying interpretability and trust in machine learning systems. arXiv:1901.08558 [cs, stat], 2019.
[2] H. Azevedo-Sa, S. K. Jayaraman, C. T. Esterwood, X. J. Yang, L. P. Robert, and D. M. Tilbury. Real-time estimation of drivers’ trust in automated driving systems. International Journal of Social Robotics, 2020.
[3] L. P. Robert, A. R. Denis, and Y.-T. C. Hung. Individual swift trust and knowledge-based trust in face-to-face and virtual team members. Journal of Management Information Systems, 26(2):241–279, 2009.
[4] W. Han and H.-J. Schulz. Beyond trust building — calibrating trust in visual analytics. 2020 IEEE Workshop on TRust and EXpertise in Visual Analytics (TREX), p. 9–15, 2020.
[5] E. Mayr, N. Hynek, S. Salisu, and F. Windhager. Trust in information visualization. EuroVis Workshop on Trustworthy Visualization (TrustVis), 2019.
[6] R. Borgo and D. J. Edwards. The development of visualization psychology analysis tools to account for trust. http://arxiv.org/abs/2009.13200, 2020.
[7] G. Gartner. Towards a research agenda for increasing trust in maps and their trustworthiness. Kartografija i Geoinformacije, 21, 2023.
[8] J. B. Rotter. A new scale for the measurement of interpersonal trust. Journal of personality, 1967.
[9] J. D. Lewis and A. Weigert. Trust as a social reality. Social forces, 63(4):967–985, 1985.
[10] N. Luhmann. Trust and power. John Wiley & Sons, 2018.
[11] G. Simmel. The philosophy of money. Psychology Press, 2004.
[12] C. F. Sabel. Studied trust: Building new forms of cooperation in a volatile economy. Human relations, 46(9):1133–1170, 1993.
[13] J. B. Barney and M. H. Hansen. Trustworthiness as a source of competitive advantage. Strategic management journal, 15(S1):175–190, 1994.
[14] L. A. Crosby, K. R. Evans, and D. Cowles. Relationship quality in services selling: an interpersonal influence perspective. Journal of marketing, 54(3):68–81, 1990.
[15] E. Delgado-Ballester, J. L. Munuera-Aleman, and M. J. Yague-Guillen. Development and validation of a brand trust scale. International journal of market research, 45(1):35–54, 2003.
[16] E. Garbarino and M. S. Johnson. The different roles of satisfaction, trust, and commitment in customer relationships. Journal of marketing, 63(2):70–87, 1999.
[17] J. M. Digman. Higher-order factors of the big five. Journal of personality and social psychology, 73(6):1246, 1997.
[18] D. M. Rousseau, S. B. Sitkin, R. S. Burt, and C. Camerer. Not so different after all: A cross-discipline view of trust. Academy of management review, 23(3):393–404, 1998.
[19] A. M. Evans and W. Revelle. Survey and behavioral measurements of interpersonal trust. Journal of Research in Personality, 42(6):1585– 1593, 2008.
[20] B. McEvily and M. Tortoriello. Measuring trust in organizational research: Review and recommendations. Journal of Trust Research, 1(1):23–63, 2011.
[21] E. Glikson and A. W. Woolley. Human trust in artificial intelligence: Review of empirical research. Academy of Management Annals, 14(2):627–660, 2020.
[22] M. Ghazizadeh, J. D. Lee, and L. N. Boyle. Extending the technology acceptance model to assess automation. Cognition, Technology & Work, 14:39–49, 2012.
[23] P. A. Pavlou. Consumer acceptance of electronic commerce: Integrating trust and risk with the technology acceptance model. International journal of electronic commerce, 7(3):101–134, 2003.
[24] D. Ullman and B. F. Malle. What does it mean to trust a robot? Steps toward a multidimensional measure of trust. In Companion of the 2018 acm/ieee international conference on human-robot interaction, pp. 263–264, 2018.
[25] R. R. Hoffman, M. Johnson, J. M. Bradshaw, and A. Underbrink. Trust in automation. IEEE Intelligent Systems, 28(1):84–88, 2013.
[26] R. C. Mayer, J. H. Davis, and F. D. Schoorman. An integrative model of organizational trust. Academy of management review, 20(3):709–734, 1995.
[27] R. M. Morgan and S. D. Hunt. The commitment-trust theory of relationship marketing. Journal of marketing, 58(3):20–38, 1994.
[28] M. A. Borkin, A. A. Vo, Z. Bylinskii, P. Isola, S. Sunkavalli, A. Oliva, and H. Pfister. What makes a visualization memorable? IEEE transactions on visualization and computer graphics, 19(12):2306–2315, 2013.
[29] S. Pandey and A. Ottley. Mini-VLAT: A short and effective measure of visualization literacy. In Computer Graphics Forum, vol. 42, 2023.
[30] Pandey, Saugat, et al. “Do You Trust What You See? Toward A Multidimensional Measure of Trust in Visualization.” arXiv preprint arXiv:2308.04727 (2023).
- Categories: