Diagramming Explanatory Narratives
Causal Storyboards: Augmented Interactive Visualisation for Narrative Abduction
Tim van Gelder, Director, Hunt Laboratory for Intelligence Research, University of Melbourne
Project team members: University of Melbourne: Richard de Rozario, Morgan Saletta; Monash University: Tim Dwyer, Kadek Satriadi; LAS: Christine Brugh, Jacque Jorns, Bo Light
Introduction
Intelligence analysts are frequently trying to figure out what is really going on in some situation. Often, they do that by coming up with a story that explains the known facts about the situation. Indeed a good analyst will consider a number of alternative stories, and try to assess which is most plausible, given how well they each explains the evidence.
We call this kind of reasoning narrative abduction. Abductive reasoning generally is one of the “big three” types alongside deductive and inductive reasoning. The essence of abduction is the idea that an hypothesis’ ability to explain the evidence is a guide to its truth. Narrative abduction is where hypotheses take the form of narratives, defined as representations of sets of causally connected events – this led to that led to…
Narrative abduction has received surprisingly little attention in the literature on intelligence analysis. In a 2022 project, we investigated its epistemological foundations, and piloted two different frameworks for narrative abduction, with each framework consisting of an analytic method and collaboration software supporting analyst teams in the use of that method.
One thing uncovered by that project was how complex narrative abduction is as a reasoning process. This complexity can manifest in many ways, including in the explanatory narratives themselves; in the evidence set; in the fit between a given narrative and the evidence; and in assessment of relatively plausibility of a set of alternative narratives, each fitting in a different way with the evidence. Handling this complexity is cognitively challenging, and indeed we have been increasingly impressed that analysts (like others such as scientists, and people generally) can manage it at all. When narrative abduction goes wrong – mis-estimating the plausibility of an explanatory narrative – the sheer complexity is a contributing factor, alongside other cognitive factors such as motivated reasoning and (in some cases) organisational factors such as politicisation.
One way to help the human mind cope with complexity is, of course, visualisation.
Our objectives
Hence our 2023 project has been focused on how to augment narrative abductive reasoning with diagrams. This breaks down into three main challenges:
- Define a visual language for diagramming narrative abductive situations. This is a combination of an ontology, specifying what kinds of objects and relationships can appear as elements such diagrams, and recommended conventions for representing these elements.
- Develop a software authoring tool, to help analysts rapidly and easily develop and modify such diagrams for their specific analytic challenges.
- Explore how generative AI can be used to auto-generate such diagrams, in draft form, thus helping analysts more quickly reach the point where they can make better-grounded estimates of narrative plausibility.
Phase 1 – Developing a diagramming approach
Our project has had two phases, each taking roughly half the year. Phase 1 was exploratory, investigating options for all three challenges. Regarding the visual language, we cast a very wide net, trying to identify all possible ways in which narratives and evidence sets might be visually displayed, aiming to identify the approach that would be most useful in the specific context of supporting intelligence analysts narrative abductive reasoning. Narratives are of great interest in many areas; there is even a research field called narratology.
We had started this search with an option at the front of our minds – the causal storyboard – and after many weeks of exploration, we concluded that this was indeed the most promising approach, and the right one to further develop in the remainder of the project. The idea is illustrated by this simple diagram of the storyline from the first verse of the well-known nursery rhyme:
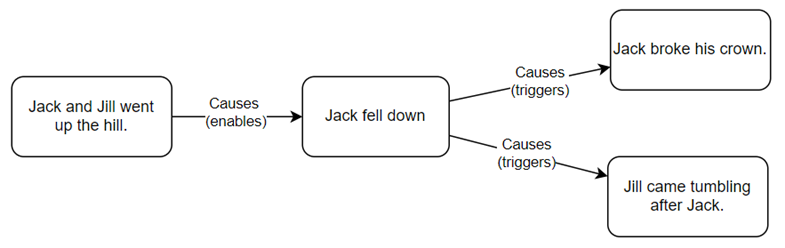
They are “box and arrow” diagrams with boxes corresponding to events and arrows to causal connections between those events. Causal storyboards make explicit not just what the events are, but the causal structure of the storyline. For example, the storyboard makes clear that Jill’s tumbling was caused by Jack’s falling down, not by Jack’s breaking his crown.
For narrative abduction, we need to do more than just represent storylines; we need to display the extent to which they explain the available evidence. Also, we want to be able to compare different narratives in terms of their explanatory power. For these tasks we developed a more complex format, illustrated here:
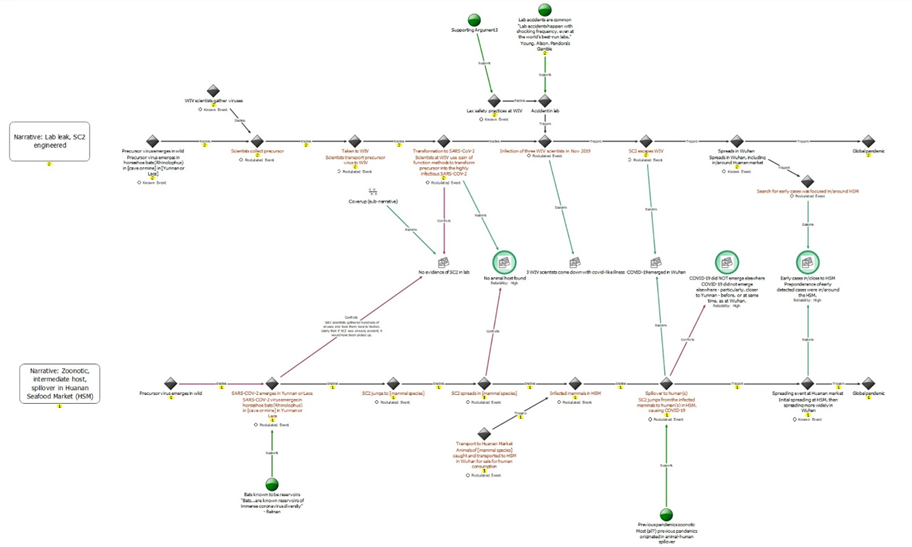
This diagram represents a portion of the abductive reasoning related to the contentious issue of the origins of Covid-19, a topic that the US IC has investigated and remains divided on. A certain amount is known about the situation, such as that the pandemic started in Wuhan, China. But what explains these facts? There are essentially two narratives. One is zoonotic: at a high level, it is that the virus emerged in bats, jumped to wild animals, and then to humans in the wet market section of the Huanan Seafood Market. The other is the lab-leak narrative, in which (in one version) the virus was the result of gain-of-function research at the Wuhan Institute of Virology (WIV), and escaped from there.
The diagram has three levels or swimlanes. The upper swimlane contains a causal storyboard for a more detailed version of the lab-leak narrative; the middle one contains the various items of evidence that any narrative would need to explain, arranged in roughly chronological order so to align with the causal storyboards; and the lower swimlane contains a version of the zoonotic narrative.
The arrows linking the causal storyboards to the evidence items represent relationships of explanation (green) or conflict (red). For example, both narratives explain the fact that the pandemic originated in Wuhan (4th evidence item from the left), and so there are green lines from both causal storyboards to that item. Zooming out, the diagram allows a viewer to scan the “fit” between the narrative and the evidence – at which points the narrative succeeds in explaining the evidence, and where it fails. This supports provisional assessments of overall plausibility: crudely, one narrative is more plausible than another if it has more green arrows, and fewer red arrows, than another.
Another feature of these diagrams is use of the space above the upper storyboard, and below the lower storyboard, for diagrammatic representation of additional reasoning related elements of the narrative. For example, an important element of the lab leak narrative is that there were lax safety practices at the WIV. Arguments and evidence that there were indeed lax safety practices sits above and feeds into the lab leak storyboard at the relevant point.
This particular diagram is meant to illustrate causal storyboarding for narrative abduction, not to be a proof that one Covid narrative is correct or more plausible. The Covid origins debate is very complex and the diagram only displays only a portion of it, at a high level. Also, a diagram of this kind essentially embodies many judgements that might be contested by somebody with a different orientation. These judgements include what information to include or exclude as evidence items; how to “frame” (express) those items; and whether or not a given narrative explains or conflicts with those items. One critical function of these kinds of visualisations is making such judgements explicit, so they can be shared and discussed in a more open and systematic manner than might be the case, for example, in a tussle around a meeting table.
Phase 2 – Developing an AI-augmented authoring tool
The diagram above was drafted in Analysts Notebook, a link analysis tool widely used in intelligence and policing. This was one of the many software environments we investigated as a potential starting point for developing our authoring tool; others included an excellent timeline application, and Microsoft Visio, a generic diagramming package. For a while, Analyst’s Notebook seemed, on balance, to be the most promising. However, we discarded this option when we found out about the limited availability of Analyst’s Notebook in the relevant agency, given that they had their own preferred alternative.
We settled instead on using draw.io as our base application. This is a very feature-rich diagramming environment with the important advantage of being free and open-source, so we would be able to easily distribute our authoring tool to potential users.
In the second phase of our project, then, we have been developing an AI-enhance authoring environment in the form of a plugin for draw.io. At a base level, the plugin adds features to draw.io intended to expedite the manual creation and modification of diagrams using the visual language illustrated above, including the three-lane format.
A key feature emerging in the plugin is the partial auto-generation of diagrams using GPT. At this time this feature can do a passable job of generating first-draft causal storyboards for explanatory narratives. This process is illustrated in the next figure:

The current workflow for auto-generation is:
- In the GPT Authoring Window (A), the analyst interacts via chat with GPT, instructing it to create the storyline (list of connected events) for the causal storyboard the analyst wants to see in the diagram. Behind the scenes, the authoring window has already provided GPT with some information about causal storyboards and how to build them. The chat continues until the analyst is satisfied with the storyline.
- The analyst clicks the Send button to transfer the storyline to the GPT JSON Generation window (B). It appears as raw text in the upper pane in the window; here the analyst can do some fine-tuning.
- When satisfied, the analyst clicks Generate in the GPT JSON Generation window. This triggers two things. First, GPT converts the raw text storyline to JSON; this code can be seen appearing in the lower pane as it is being generated. Second, the plugin uses the code to generate a draft causal storyboard diagram (C).
- The analyst further refines the causal storyboard, making manual modifications.
For the current project, we are only implementing auto-generation for causal storyboards for candidate explanatory narratives. Further challenges include auto-generation of a first-cut list of relevant evidence, and the links indicating that a given narrative explains, or conflicts with, items of evidence.
Conclusion
Overall, by the close of this project we will have delivered – for the first time – a visual language for diagrams of narrative abductive reasoning, as illustrated in the Covid diagram above; a software authoring environment for developing such diagrams, implemented as a plugin for draw.io; and limited auto-generation capability drawing on GPT.
There is plenty of scope for future work in all three areas. The visual language can be extended and refined; the authoring tool could be improved in functionality and usability; and the auto-generation extended to the point where it can develop complete diagrams, at high quality, with minimal prompting.
Another area for ongoing research is tackling what we call the “hard problem of epistemology” – how does one “weigh up” the relevant considerations so as to properly judge the plausibility of an explanatory narrative? The current role for visualisations and tools of the kind we have been developing is to assist analysts to make overall assessments, which still needs to be done in an intuitive, holistic manner. At some point in the future, AI will be able to not just generate draft diagrams, but make overall plausibility assessments. However, deeper understanding of the principles involved is required to ensure that such judgements are accurate and explainable.
- Categories: