Voice Characterization Analytics for Triage
Tina Kohler, Michelle Winemiller, Patti Kenney, Jacque Jorns, Pauline Mevs, Sean Lynch, University of Texas at Dallas
What we’re trying to do
In a world containing big piles of voice data, small numbers of experienced analysts, and decision makers needing accurate and immediate information from the data piles, effective content triage options are vital to locate the unknown unknowns.
Our corporate tool suite contains many methods for searching data, but sometimes analysts have no idea how to start looking for the good stuff when they’ve exhausted all the search methods available to them. When their traditional tools still leave them with too much data to assess, what can they do? Researchers and analysts at the Laboratory for Analytic Sciences have been jointly thinking about and discussing this problem and decided to investigate methods to provide analysts with information about how people are talking. We believe if there are speech segments in which people are expressing some sort of emotional, prosodic, or acoustic abnormality, then it’s probable something interesting is happening. This abnormality is now a possible unknown-unknown that can be quickly investigated.
One method for representing how people are talking is emotion, i.e. what the speaker is feeling, and a popular approach for representing emotion in speech is the circumplex model. This model represents valence (expressing positive or negative feelings) and arousal (the amount of energy, activation, tension in the speech) on one plot, as shown in the figure below.
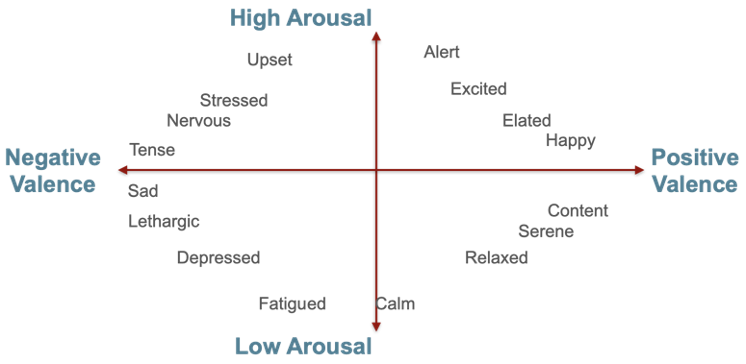
As you can see, the center of the plot represents neutral emotions with normal (neither high nor low) energy and neutral (neither positive nor negative) feelings.
Lamentably, it’s difficult to accurately place some emotions on the circumflex model. For example, although anger is certainly a negative feeling, some people express it by talking loudly (high arousal), while others become more quiet (low arousal), and still others may have a normal amount of speech energy. Because many emotions cannot be accurately placed on the circumplex model, indicating it will be difficult to label them based on acoustic measurements, the voice triage team focused on finding segments containing high-arousal speech for their 2022 research goal.
Where we got data
In previous years the team investigated several different emotionally-labeled voice corpora and learned most appear to be unsuitable for our research because they are not realistic. For example, some corpora hired actors to express a specific emotion while reading sentences. For other corpora, speakers were asked to describe situations or images that should elicit specific emotions, e.g., “describe a traffic accident that made you angry.” Although these collection techniques do produce accurately-labeled data for a moderate cost, they are not realistic.
After looking at many existing corpora we choose to evaluate those containing large amounts of realistic, non-acted conversational speech. Our top choice as our initial research corpus was the Multimodal Signal Processing podcast(MSP Podcast) corpus from University of Texas at Dallas. It stood out because of its size, real conversations, and wealth of annotations. This corpus contains segments from podcasts with creative commons licensing. Each segment is annotated via crowdsourcing with categorical and circumflex labels. The latest version (1.10) of the corpus contains over 100,000 segments.
We performed an analysis of the corpus and selected a subset of segments that contained at least five seconds of speech and arousal labels for which the annotators were in higher agreement. Even with this somewhat aggressive filtering we had over 11,000 segments for training, and over 6,000 segments for testing and validation.
The figure below shows valence and arousal labels for the 73,000+ segments in version 1.8 of the corpus, which we used in our project.
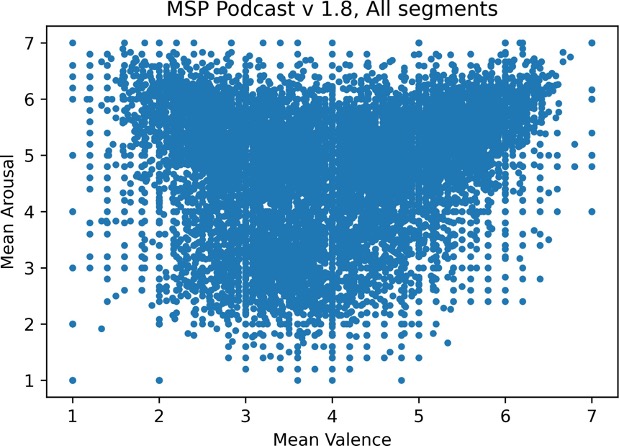
The corpus uses a 7-point Likert scale for both arousal and valence annotations. For valence, negative emotions are represented with lower numbers and positive emotions are represented with higher numbers. For arousal, the number directly represents how awake or activated or energetic the speaker is. For both a 4 represents neutral speech. In looking at the plot you’ll notice there are many segments in the middle (representing neutral speech), few segments in the corners representing very negative valence or very high arousal, and no segments with very positive valence and very low arousal. If you consider the conversations you have every day, most of them are probably neutral and few of them are extremely negative or extremely positive, and this plot illustrates the realism that exists in the MSP Podcast corpus.
What we did with the data
We investigated many variations of both features and support vector machine (SVM) kernels in our research.
The two feature extraction algorithms we used were OpenSMILE (developed by audEERING) and wav2vec(developed by Facebook). OpenSMILE is an open-source toolkit that provides not only dozens of acoustic and prosodic feature extraction capabilities, but also provides a variety of functionals to map periodic temporal measurements to a vector of fixed dimensionality.
Facebook’s wav2vec uses a convolutional neural network to convert speech into a general representation vector. Since wav2vec creates a 512-element vector for every 10 milliseconds of speech (100 vectors per second), we used OpenSMILE’s functional calculations to generate the fixed-dimensional vectors expected by the support vector machine.
The figure below shows our experimental framework.
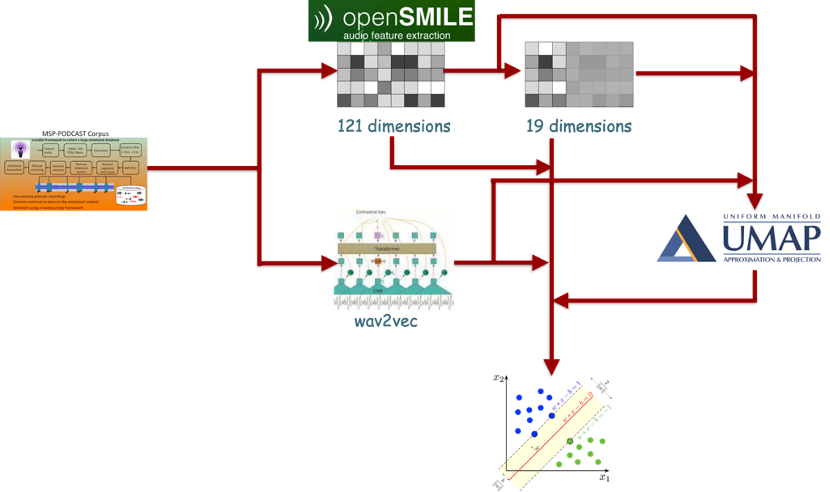
As the framework shows, we experimented with many paths from the input MSP podcast voice segments to create the input features for the SVM algorithm. We leveraged previous research to select both 121- and 19-dimensional openSMILE features. And we used the results of our previous year’s experiments with dimensionality reduction algorithms to include Uniform Manifold Approximation (UMAP) in the path for all the feature options. Even relying on previous years’ results, we still had many questions to answer in our experiments, such as: Which OpenSMILE functionals should we use on wav2vec features? Will UMAP perform well, and if so, which parameters are best? Which SVM kernel should we use? What kernel parameters should we use with SVM?
We ran over 70,000 experiments to try to answer these questions. The plot below shows how well they performed.

Each dot represents the equal error rate (EER) for one experiment. Since this is an error measurement, lower is better. It’s pretty evident from this plot that we had some real duds.
Our baseline system had 32.5% EER, and as the plot shows, we had many experiments that improved on the baseline. In the end, our best performance was under 24% EER for wav2vec features with three functionals using the radial basis function (RBF) kernel of the SVM.
We also used a more application-specific error rate: the probability of a false reject when holding the probability of a false alarm at less than 10% (i.e. what percentage of true positives do we miss when we try to limit the false positives to 10%?). Our best application-specific error rate was 46%, i.e. with only 10% false alarms you will miss 46% of the high-arousal speech segments. This was achieved with wav2vec features with six functionals and the same radial basis function SVM kernel.
We wondered if the two feature sets performed very differently across the entire sweep of false-alarm/false-reject possibilities, and produced the detection error tradeoff (DET) plot below to compare them.
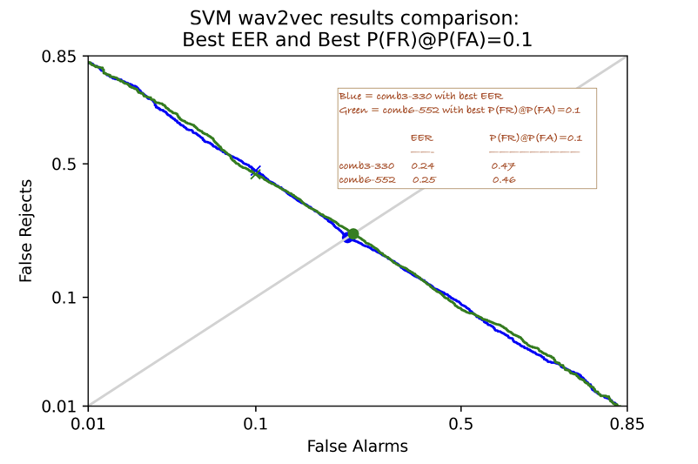
A DET plot represents all the possible false-alarm/false-reject possibilities as you sweep score thresholds. If low false-alarms are important then the user can require a high score which will indeed reduce the false positives, but will also increase the false rejects. Conversely if the user doesn’t want to miss anything a low threshold will reduce the false rejects at the cost of more false positives.
This comparison plot shows the curve for both feature sets. We’ve also provided the values of the two error measurements as text on the plot. We were pleased to discover they perform very similarly. It’s probable analysts will not notice the difference with either one since they are so close.
What we learned
Our year of experimentation not only taught us a lot about the features and kernels we examined, we were also able to reduce the equal error rate by over 8% absolute. We have not yet determined whether this is a statistically significant improvement, but with the large size of our experimental corpus, we believe it is. Although our approach is still far from perfect, we believe our algorithm performs well enough to aid analysts in getting to the good stuff faster.
What’s Next?
The LAS leadership team has decided to continue this work in 2023, and we have several ideas on our plate. We want to investigate new features such as wav2vec2 and XLSR-53. This year we started laying the groundwork to explore what happens when we include linguistic features such as sentence vectors or sentiment labels and we intend to continue this approach. We also intend to pursue new machine-learning algorithms, most especially deep networks.
We don’t intend to limit our research to only one corpus next year. Although the MSP Podcast corpus worked very well for this year’s evaluation, we will assess our features and algorithms on additional corpora from other realistic labeled data as well as voice data from other LAS projects, especially the Nixon Whitehouse recordings used by many of the PandaJam family projects and audio-from-video collected for the EyeReckon project.
We’re also keen to partner with others, so please let us know if you’re interested in working with us.
- Categories: