Hybrid Teams and Purposeful Levels of Automation
Drs. Judy and Rob Johnston, Johnston Analytics
Introduction.
With the evolution of machine learning and artificial intelligence, as well as the increasing recognition of the assistance they can provide to tasks in the research for and development of intelligence analysis products, we are witnessing the growing implementation of hybrid teams to address intelligence questions. For our purposes, hybrid teams are defined as teams that include both human and machine members. The team size can vary from dyads (humans plus machine/tool) to larger groups (several humans plus machine/tool).
While the academic community, especially the human factors field of psychology, has been investigating how to define levels of automation in teams of varying sizes, there has been little research on optimal team/machine composition as well as criteria to guide selection and implementation of tools for best performance. Additionally, there is little empirical research that addresses the benefits and disadvantages the inclusion of machine-based teammates may comprise.
In the world of practicing analysts, we have found many instances of tool use for the sake of the tool, a phenomenon we call automation motivation. In other words, a developer or manager or user makes the decision to automate some portion of the workflow simply because it can be done. In some instances, the tool turns out to be quite helpful. More often than not, however, the tool introduces new challenges in the workflow and either adds an additional burden on the analyst or ends up not being used at all, sometimes giving analysts an overall negative impression about the helpfulness of automation.
It is this automation motivation phenomenon that motivated the exploration of levels of automation and led to our development of a working model that provides feedback through simulation that will eventually inform evaluation of a particular tool as either a helpful or not-so-helpful potential hybrid partner. It will also inform design features, as we have identified a number of variables that have the ability to help or hinder an analyst’s progress.
The goal of this project was to describe levels of automation, identify those that are relevant to intelligence analysis, and determine which levels of automation are the best suited to those analytic activities. We intended to do this by developing and testing a theoretical framework that includes characteristics of automation and the user’s interaction with automated tools, variables that impact user’s performance during tool use in the workflow and afterwards. It is our hope that this theoretical framework will aid in determining selection and implementation of automated ‘team members’ that will support the execution of identified tasks and improve team performance.
How we did it.
Our work progresses in four stages: integrative literature review, develop and model theoretical framework, conduct use cases to collect data on the variables in the framework based on use of LAS-developed tools that have a level of automation component, and test the model/theoretical framework by running simulations of the model with the data collected in the use cases.
1. Integrative Lit Review
The integrative literature review was guided by these overarching questions:
- How are levels of automation defined?
- What engagement of human team members is required to support automation?
- How do human team members support automation, from a tasking perspective?
- What types of tasks can automation successfully replace or support?
- What impact (and type of impact) do levels of automation have on team performance?
We searched predominantly empirical studies in the disciplines of industrial organizational psychology, computer science, educational technology, anthropology, sociology, statistics, economics, and social psychology. We also followed studies in the Department of Defense, particularly the Air Force, where studies of automation in air crews were responsible for some of the seminal work in automation.
We determined that the gap in research had to do with the ways researchers were studying automation. Most studies showed a very discrete distinction between the user and the tool and focused on performance outcomes. We were not seeing a lot of work that explored more than one or two variables, or that examined the interplay of the user and the tool. This was especially relevant when trying to compare automation results in, for example, air crews and those with intelligence analysts. One is physical and cognitive and the other is mostly cognitive.
2. Modeling the Theoretical Framework: Mapping the Process
As a result of our effort, we set out to create a theoretical framework that provided a holistic presentation of variables that arise from either the user or the tool and affect either or both in the process of conducting intelligence analysis. We used “Stella Architect” to create a process map to capture the variables we identified, as well as their relation (if any) to each other. Stella Architect (SA) is a systems dynamics modeling software. The main principles of systems dynamics that ‘drive’ models recognize the importance of examining a system (i.e., the whole is greater than the sum of its parts) and the importance of the existence of feedback loops within the system. Systems dynamics modeling allowed us to look at variables, relations, and feedback loops that may exist in the process of an analyst working on a hybrid team to address intelligence questions.
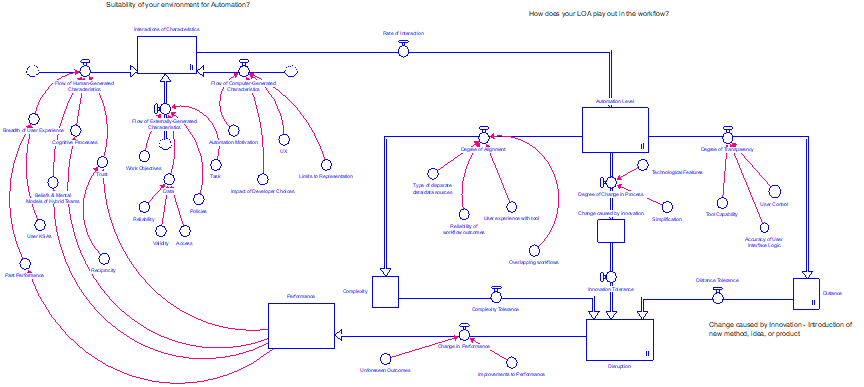
The mapping process was conducted in stages and resulted in 12 versions of the theoretical framework before the team was satisfied that variables and relationships were properly identified and arranged. During the mapping process, we identified over 20 variables that can impact user’s performance, based on the tool’s level of automation. The major elements of the model included: Characteristics that define the user and the tool, Automation level, Disruption (complexity, innovation, distance), and Performance. Figure 1 provides a representation of the final version of the model.
3. Conduct Use Cases
We selected three LAS-created tools as subjects of the use cases: Social Sifter, Belt and Road Initiative (BRI) Dashboard, and the Common Analysis Platform (CAP).
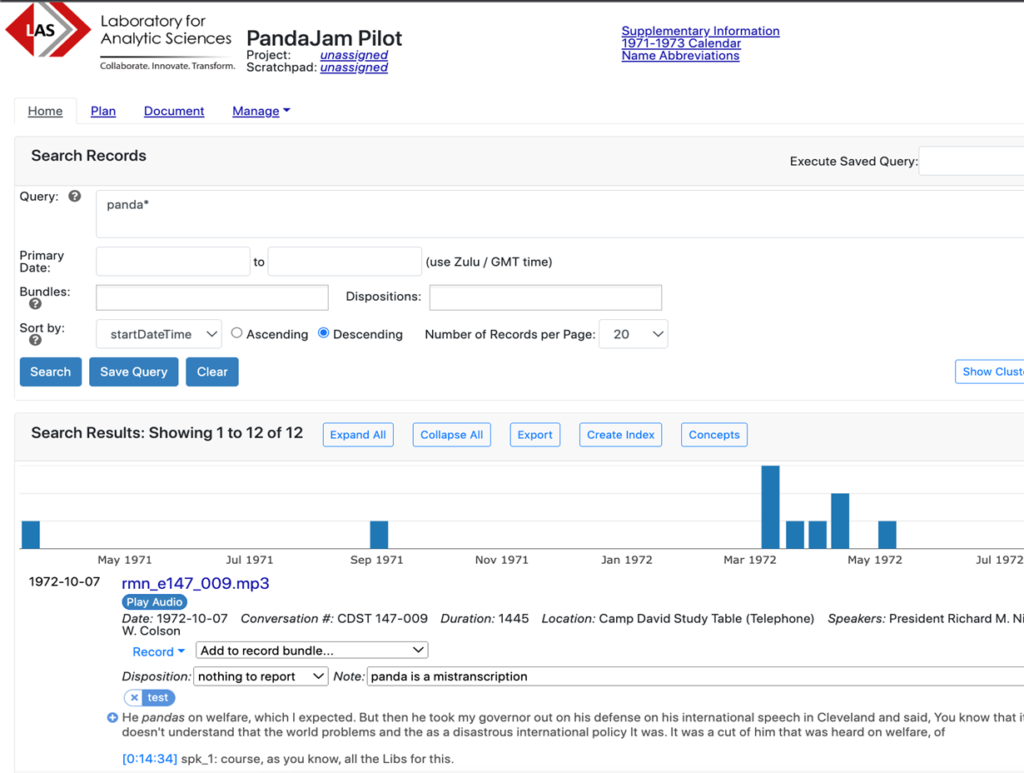
Social Sifter
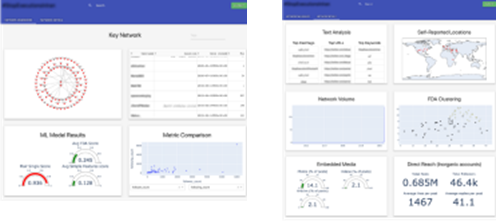
Social Sifter is a flexible platform that can integrate contributor algorithms, designed to extract signals from large corpora of social media data, and reduce signals into a manageable data set (key network) that reveals account and community patterns indicative of: (1) Coordinated activity of influence campaigns, and/or (2) Manipulation via inauthentic accounts and behavior. Presently, the Social Sifter platform integrates six different algorithms as well as additional analytics to improve user understanding of the individual attributes of a network of accounts warranting evaluation. Model results are displayed alongside visualizations of the network/activity to allow for user interpretation of findings. Social Sifter can currently ingest data from Twitter, Reddit, and YouTube Comments into a consistent format, and in follow-on work could be tuned toward the types of actors or platforms of interest. Screen shots of results of a Social Sifter analysis are shown in the figure below.
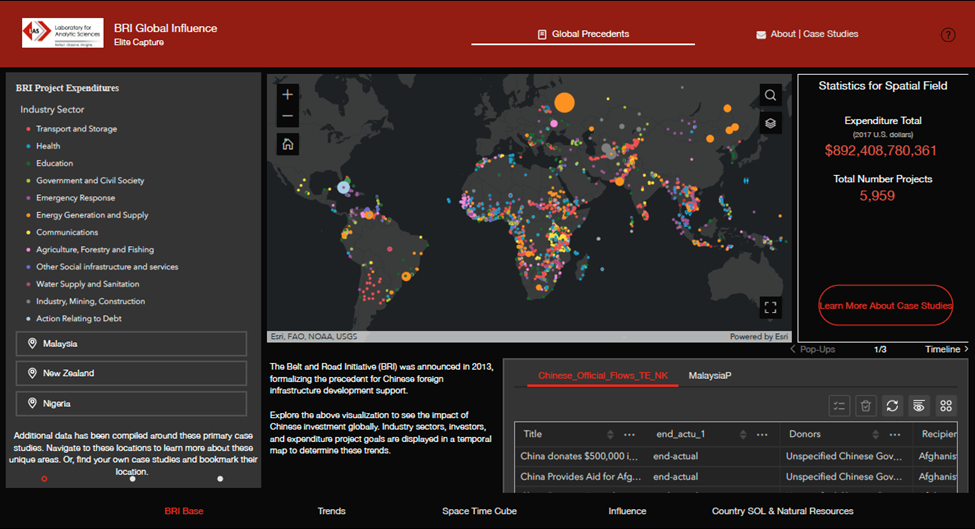
Belt and Road Initiative Dashboard
In the quest to achieve a grand “rejuvenation of the Chinese nation” the CCP has drawn upon its large wealth and vast diaspora populations around the world to build various development projects. These projects are part of a broader Chinese campaign called the Belt and Road Initiative (BRI) and have included everything from constructing railroads, highways, and port cities, to establishing schools, media strongholds, preferable trade agreements and beneficial political relationships. Some of these projects have increased China’s overall global influence, while others have elicited hostile reactions from host countries wary of becoming beholden to China. The dashboard screen shot pictured in the below was created to address the BRI.
Common Analysis Platform
CAP (the Common Analytic Platform) is a heavily instrumented system developed in-house at LAS, designed to provide a common (across datasets) and familiar interface for analysts to search and explore text datasets. It has been used extensively in the PandaJam family of projects, as a platform for our experiments aimed at understanding how analysts answer questions on the Nixon Whitehouse Tapes dataset.
We conducted at least two discussion sessions per use case that included Hybrid Team (HT) project members, and expert users with familiarity of development of the tool as well as experience as users. The sessions began with an overview of the tool that included its main objectives and how the tool was meant to be used. HT members would present the model and discuss its purpose as well as what we hoped to learn to advance the accuracy of the model. We used the variables in the model to drive the order of the discussion. As definitions of variables were presented, we encouraged an interactive discussion format so that expert user observations and inputs could help refine the definitions. Once we reached a common understanding of the definitions (from the HT team) and how they applied to the tool under study (from the expert users), we asked the expert users to advise us on numerical values for each of the relevant variables to include in the model for the purpose of simulations. We used a scale of 1-10, with 1 as the lowest rating and 10 as the highest rating. We routinely worked towards consensus on the variable values among all the discussants.
4. Test the Model
We populated the model with the data from each of the use cases and ran simulations in the hopes of obtaining some degree of validity, to explore the potential for generalizability, and to identify any significant variables and/or relationships. Based on discussions and walk throughs with expert users of the tools, we reached consensus on ratings for each of the aggregate variables. The aggregate variables where we saw a reasonably significant difference were: (Change Caused by) Innovation and (Cognitive) Distance. A possible explanation for the limited number of significant differences could be the limited differences in the Levels of Automation of the three tools. Those LOAs being either 5 for Social Sifter or 4 for both the BRI Dashboard and CAP. We have described automation at level 4 as “batch processing” – computer completely carries out singular or sets of tasks commanded by human. And we described level 5 as “shared control”- computer and human generate decision options, human decides and carries out with support. (Endsley, M.R. & Jones, D.J. (2012). Designing for Situation Awareness: An Approach to Human-Centered Design (2nd ed.), p. 185. Boca Raton, FL: CRC Press. Copyright 2012 by Taylor and Francis Group.)
Comparing Causal Loops. The advantage of using systems dynamics modeling for multivariate issues is that it is possible to identify simple feedback loops and significant causal loops from simulation runs. These causal loops identify the variables that are most significantly connected, showing impacts in one or more direction. When conducting simulations, we focused on these causal loops as a method of comparison amongst the use case tools as well as a way to gain insights on the accuracy of the model. The figures that follow show the identified causal loops for the use case tools we studied.
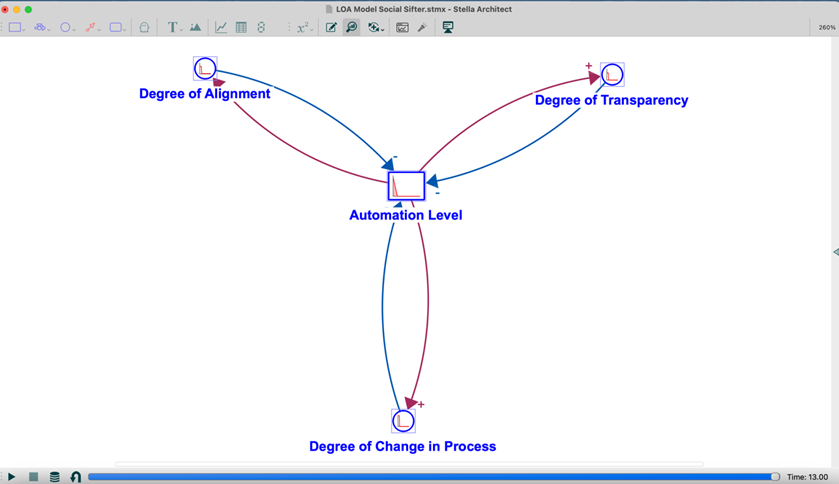
The causal loops for both Social Sifter and the BRI Dashboard contained the same variables in the same relationships to automation level. Degree of alignment, degree of transparency, and degree of change in workflow/process all were shown to influence and be influenced by the level of automation of the tool under study. These elements are all represented as Flows in the model (Flows represent activities; they control the filling or draining of stocks, causing conditions to change) and also occur in the part of the model that examines what is done with the tool, as opposed to those characteristics that exist in the part of the model that examines the operational environment of the tool.
Degree of alignment describes the alignment between level of automation and complexity. Degree of alignment/complexity is generated in the model by values assigned to the alignment of task with the amount and types of disparate data sources, overlaps of workflows, reliability of workflow outputs, and user experience.
Cognitive distance refers to the proximity between user and their awareness of a task and the user’s awareness of the behavior of the tool in carrying out/supporting tasks. Degree of transparency describes the level of cognitive distance that exists for the user with the tool under study. The model uses determined values of user interface, tool function, and perspective to do this.
Changes resulting from innovation were identified as related to technological features (generally adding more, useful features to an existing tool) and/or task simplification (making tool use more streamlined). Degree of change in workflow/process refers to how much or how little the workflow or work process is changed due to innovations as described.
The significance of the degree of transparency for both Social Sifter and the BRI dashboard is that there is more going on behind the scenes for users of each tool. This contributes to a greater cognitive distance – a relationship that JA identified via expert experience and the literature. Similarly, the impact of change in process by either increased technological features or task simplification or both is more sensitive when the tool function provides more automation. Lastly, the degree of alignment between complexity and automation seems to be more significant when the tool is at a higher level of automation.
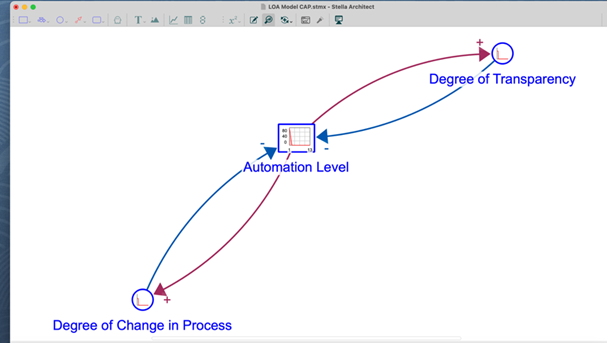
In the simulations of the model with CAP data, we find that degree of alignment is not a factor, while degree of change in process and degree of transparency remains. It is our belief that the straightforwardness of CAP supports its transparency to the user, but also can make it more vulnerable to negative impact when innovations are introduced. This may be why degree of alignment is not identified as part of a LOA causal loop for the CAP tool.
Looking Ahead.
We believe that the information we derived from use cases, review of literature, and modeling/simulation provides a reliable, holistic view of the interaction between user and tool in a hybrid environment. Further, the model allows for the identification of benefits and challenges in any particular hybrid partner (tool). Testing our theoretical framework by running simulations on a number of additional tools that represent a wide variety of levels of automation would strengthen it and support some level of generalization. Ultimately, the model can be used to support purposeful automation by fitting the benefits and challenges of the tool to the needs of the user – either in an evaluative mode or a design mode.
- Categories: