CARD: Content-Aware Recommendation of Data
PUNCH Cyber Analytics Group

We have been working with LAS to develop CARD, a front-end for our recommendation pipeline ORBS. ORBS is the culmination of our work with LAS in previous years, and with CARD we are bringing these recommendations to the analysts. We found that we were able to train algorithms to identify SIGINT data of interest to analysts with a 90% accuracy or higher. We formalized these models with ORBS, which is built following the blueprint standard production-ready recommendation pipelines. It consists of several components that we summarize in the following figure:

We designed CARD to allow users to interact with this pipeline at multiple points. We thus briefly discuss the roll of each component so we can
Data Ingest and Pre-processing: Load data through the desired interface (DVC, AWS, Airflow, etc.), then transform the data with a set of fixed scripts to produce a dataset that our models are prepared to handle. Transformations include scrubbing sensitive data, dropping/transforming columns to save space, converting columns into a format a downstream ML system may require, etc.
Feature Engineering: Feature engineering is a blanket term for a variety of manipulations that can be done to a dataset to improve ML training performance. Columns can be split, combined, transformed, added, deleted, and so on. These features are stored in a feature store, which for ORBS is provided by Feast.
Training/Evalution: ORBS currently contains a selection of recommender system algorithms that we have studied over the course of our research. Examples include XGBoost, TabNet, Random Forest, Collaborative Filtering, Embedding with K-Nearest Neighbors, and Neural Networks. The metrics for these models are sent to MLFlow where they can be accessed by users.
Deploy Model: The output of our training is a model which can be queried for recommendations as desired. We use Evidently to track the health of models as new data arrives and data drift becomes significant. Evidently allows users to manually set thresholds for model performance, which automatically signal Evidently for the need to retrain.
User Front-End: CARD
With ORBS as the foundation, we built CARD to allow users to interact with the recommender pipeline as desired. For this example, we use the Microsoft MIND dataset. ORBS was primary developed high-side SIGINT data, but the MIND dataset makes for a suitable low-side surrogate. We show an example of the primary interface here:

This interface is built in Feast, and has a few separate components: the upper table, lower table, and left column box.
Upper table – This table presents the input data for examination. The columns include everything imported during data ingestion, and the values presented are shown after pre-processing. The interface allows analysts to sort, search, and filter the entire dataset by any given column by clicking on the name of the column and selecting the desired action. We included functionality in the cells as well; the hyperlinks in the “News ID” column redirect to the Dash app, where more information about that specific entry can be found. The left column, labeled “Vote H”, is editable, and allows users to provide explicit feedback on the data, which the app then feeds into the ORBS pipeline between pre-processing and the feature store.
Lower table: This table has the same structure as the upper table, but it presents the Top N recommendations generated by the ORBS recommender system. This is a much smaller cross section of the full dataset, which means we can assign larger weights to the user feedback column. Once an analyst has input their feedback, they can then rerun the algorithm to see if they get different feedback.
Left column box: This component allows users to downselect the dataset to columns of higher interest. In our high side experiments, we found many of our experiments involved selecting specific columns and training the recommender with those columns to determine how important they were to making effective recommendations. Removing columns is also useful for speeding up the algorithm and saving resources for larger datasets.
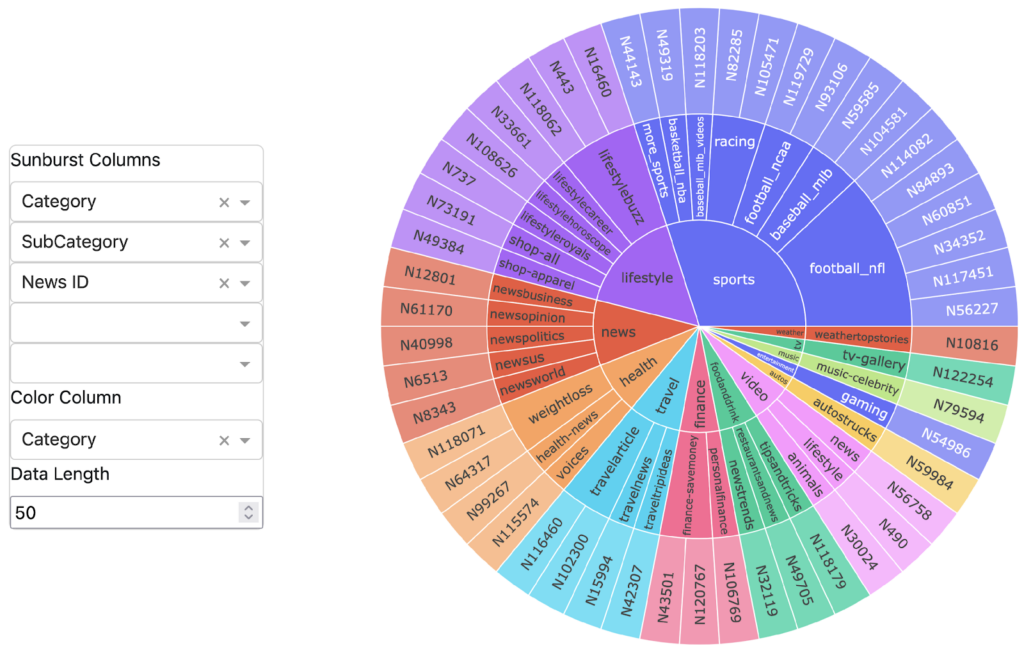
Beyond this primary interface, CARD also includes a selection of outputs that are built with Python Dash. We output a selection of aggregate database metrics to allow users to monitor column averages, medium/mode values of specified columns, and so on. We also include a fully interactive sunburst plot, an example of which can be seen here:

This plot allows users to examine the distribution and relationship of any desired columns. For larger datasets, this visualization can quickly become incomprehensible, so users can freely adjust the number of displayed entries. By clicking the plot, users can “dig down” into any column and examine in any desired detail.
Finally, CARD outputs the most recent model training results from the ORBS pipeline. While the MLFlow component of the ORBS pipeline holds the whole history and associated artifacts, the CARD output allows users to get direct feedback from the pipeline while using it.
Future Work
Going forward, the primary challenge will be working with feedback from putting CARD in front of real analysts with real recommendations. Our work to date has shown that we can confidently recommend data of interest to analysts and groups of analysts, but individual analysts may have their own preferences that need to be accounted for when they work with CARD. This feedback includes using feedback within card to improve recommendations, as well as high level feedback about using CARD and how we can improve user experience.
This material is based upon work done, in whole or in part, in coordination with the Department of Defense (DoD). Any opinions, findings, conclusions, or recommendations expressed in this material are those of the author(s) and do not necessarily reflect the views of the DoD and/or any agency or entity of the United States Government.
- Categories:


